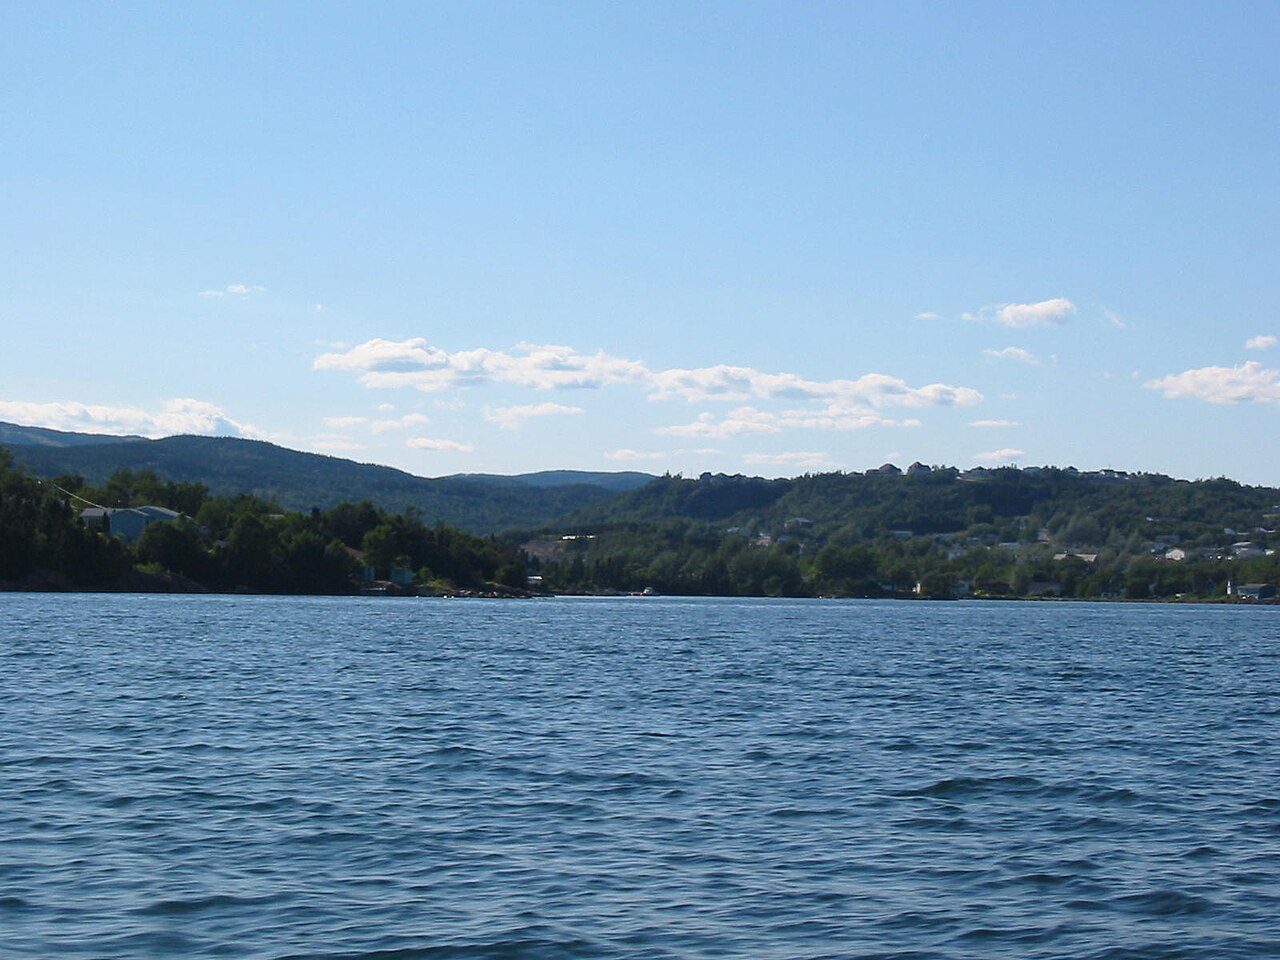
ClarenvilleNewfoundland and Labrador
7,441 people call this town in Newfoundland and Labrador home. Between 2016 and 2021, its population grew by 7%.
Is Clarenville a good place to live?
Health outcomes fall short of most towns (D). Clarenville’s overall grade, B−, puts it better than 46% of Canadian towns. That places it #10 of 32 in Newfoundland and Labrador. At $250,000, the median home value in 2021 came to 3.5 times local household income. Floods and other hazards weigh less here (A+). Elsewhere it is close to typical: B− for safety, B− for jobs & income and B− for walkability.
Figures: home values and income: Statistics Canada, Census 2021.
This town's rent is the 2021 census rent scaled to 2025 by its province's ratio of surveyed to census rents: no rental survey covers it, so its Cost Grade is less sure. Safety is the police detachment's figure, shared with the towns and countryside around it. No School Grade: this province doesn't publish comparable results school by school. Health is graded on the health region's survey figures and life expectancy, with the distance to hospital giving the town its own spread.
What makes Clarenville stand out
The 2 things Clarenville does most differently from other towns.
How Clarenville grades
Each subject compares Clarenville with Canadian towns of 2,500 or more, ordered by how far it is from the middle. Towns in other countries are graded separately.
How TownRatings grades Canadian towns →
The data
Data highlights are ordered by what stands out in Clarenville.
Clarenville is graded an A+ for hazard risk
Measured across the Eastern Regional Integrated Health Authority: radon tests
Water Resources Management Division (WRMD), Department of Environment and Climate Change, Government of Newfoundland and Labrador has mapped the flood hazard here: one study on the national inventory. In Health Canada’s survey, just 4% of homes tested in the area exceeded 200 Bq/m³ (6.6% typical). Burn scars are few around Clarenville, with 0.3% of the land within 25 km touched by fire since 1986 (0.007% a year).
Radon tests above the guideline · share of tested homes, 200 Bq/m³
| Hazards | Clarenville | Newfoundland and Labrador | Canada |
|---|---|---|---|
| Radon tests above the guideline | 4% | 4% | 6.6% |
| Earthquake loss per $1,000 of buildings a year | $0.009 | $0.011 | $0.030 |
NRCan seismic risk model and burned areas, Health Canada radon survey, the Flood Hazard Map Inventory
Chronic conditions run high around Clarenville: 24% on average, against 17% for the typical Canadian town
Statistics Canada puts life expectancy at 78.6, about level with Newfoundland and Labrador’s towns (78.6) and below Canadian towns (81.5). In the health survey, 44% of adults in the region rate their health very good or excellent, fewer than Newfoundland and Labrador’s 52%. At 17%, the share of adults who smoke tops the 15% for Newfoundland and Labrador. Measured from where Clarenville’s residents live, the nearest hospital is 2.0 km away, under the typical 3.7 km. Nobody publishes health survey and life expectancy for Clarenville alone, so this card uses the figure for the Eastern Rural Zone.
Very good or excellent health · adults, age-standardised
| Health | Clarenville | Newfoundland and Labrador | Canada |
|---|---|---|---|
| Chronic conditions (average share) | 24% | 22% | 17% |
| Very good or excellent health | 44% | 50% | 52% |
| Smokers | 17% | 15% | 12% |
| Life expectancy at birth | 78.6 | 78.6 | 81.5 |
Statistics Canada, Canadian Community Health Survey 2023/2024 and life expectancy 2022/2024; Open Database of Healthcare Facilities
July highs in Clarenville: 22.6°C, against 21.2°C in Newfoundland and Labrador’s towns and 25.5°C in Canadian towns
The coldest nights, in January, bottom out at −10.1°C, lower than Newfoundland and Labrador’s towns (−8.7°C) yet higher than Canadian towns (−13.5°C). The most precipitation falls in October: 129 mm in a normal year. The frost-free season runs from 19 June to 6 September, 78 days. Snow peaks in January: 58 cm in a normal year.
Average high by season · ECCC normals, 1991–2020
| Normals, 1991–2020 | Clarenville | Newfoundland and Labrador | Canada |
|---|---|---|---|
| Snowfall a year | 229 cm | 363 cm | 141 cm |
| July afternoon high | 22.6°C | 21.2°C | 25.5°C |
| Precipitation a year | 1,260 mm | 1,305 mm | 883 mm |
| January night low | −10.1°C | −8.7°C | −13.5°C |
Environment and Climate Change Canada, Canadian Climate Normals 1991–2020 (Lethbridge)
Housing and transport take 36% of household income in Clarenville, against 29% in the typical Canadian town
A year’s rent came to 15% of the median household income, lower than both Newfoundland and Labrador’s towns (17%) and Canadian towns (20%). 66% of households are owner-occupiers.
What homes were worth · The median owner’s estimate at the 2021 census
| Census 2021 | Clarenville | Newfoundland and Labrador | Canada |
|---|---|---|---|
| Households owning their home | 66% | 78% | 74% |
| Rent as a share of income | 15% | 17% | 20% |
| Households spending 30%+ on shelter | 19% | 15% | 18% |
| Median home value, 2021 | $250,000 | $215,000 | $406,000 |
Statistics Canada, Census 2021; CMHC Rental Market Survey via Statistics Canada · The 2021 census asked owners what their home was worth; those values, and 2020 incomes, are what this compares.
Expect November days around 7°C in Clarenville, nights around −1°C
The year peaks in July (23°C) and bottoms out in January (−10°C). Next comes December, with normal highs of 2°C and lows of −5°C. Rain and snow over a typical November come to 112 mm. Also worth knowing: the forecast on the Weather page is ECCC’s for Clarenville.
Normal highs, the months ahead · ECCC normals, 1991–2020
| Season | High | Low | Rain and snow |
|---|---|---|---|
| Winter | 0°C | −9°C | 325 mm |
| Spring | 7°C | −2°C | 288 mm |
| Summer | 21°C | 10°C | 285 mm |
| Autumn | 12°C | 3°C | 363 mm |
ECCC normals, 1991–2020 (Lethbridge); the forecast is on the Weather page
Clarenville’s MP is Jonathan Rowe (Conservative Party of Canada), for Terra Nova—The Peninsulas
With no licence on the House of Assembly of Newfoundland and Labrador’s ridings map, Clarenville isn’t placed in a riding here.
Wikidata, MAMH, MMAH, Statistics Canada
Clarenville Public Library is Clarenville’s public library
From the centre of Clarenville, it is 1.2 km away.
Provincial library statistics, OpenStreetMap, the CRA and Statistics Canada
Trips to work from Clarenville are shorter than from Newfoundland and Labrador’s towns or Canadian towns: 16 min on average
The car took 92% of commuters, in line with Newfoundland and Labrador’s towns (92%) and Canadian towns (89%).
How working residents got to work · census 2021
| Census 2021 | Clarenville | Newfoundland and Labrador | Canada |
|---|---|---|---|
| Average trip | 16 min | 19 min | 26 min |
| Car or van | 92% | 92% | 89% |
Statistics Canada, Census 2021 (labour and commuting) · The 2021 census was taken in May 2021, during COVID-19 restrictions: more people than usual worked from home or were off work.
Terra Nova National Park lies 15 km beyond Clarenville’s edge
Red Beach is the one beach within 5 km. A provincial park, Jack's Pond Provincial Park, lies 40 km away. One mapped walking route passes within 2 km: the Bonavista Rail Line.
Protected land · of the land within 10 km
| Outdoors | Clarenville | Newfoundland and Labrador | Canada |
|---|---|---|---|
| Protected land within 10 km | 0% | 0.4% | 2.3% |
| Public protected areas within 10 km | 0 | 1 | 4 |
Canadian Protected and Conserved Areas Database (CPCAD), OpenStreetMap routes and beaches
Violent crime weighs less where Clarenville is policed than in Newfoundland and Labrador’s towns or Canadian towns: a violent severity index of 58
Source area for Crime Severity Index, Violent Crime Severity Index, violent crime and property crime per 1,000: the Clarenville detachment area
For every 1,000 residents of its police area, 11.4 violent incidents are reported each year. Across its police area, there are 24.1 property incidents per 1,000 residents a year. The index for the force that serves it came to 64, about level with Canadian towns (67) and below Newfoundland and Labrador’s towns (81).
Year by year · Crime Severity Index for each year
| 2023–2025 | Clarenville | Newfoundland and Labrador | Canada |
|---|---|---|---|
| Property crime per 1,000 | 24.1 | 34.8 | 31.2 |
| Violent Crime Severity Index | 58 | 82 | 86 |
| Violent crime | 11.4 | 16.7 | 12 |
| Crime Severity Index | 64 | 81 | 67 |
Statistics Canada, Uniform Crime Reporting Survey, 2023–2025 average
Who lives in Clarenville: a median age of 45.2, 2,805 households
Immigrants make up 2.7% of residents, between Newfoundland and Labrador’s towns (1.6%) and Canadian towns (6.4%). Those 65 and older account for just over a fifth of residents. Under 15: 16% of residents.
Ages · Share of residents in each age group, Census 2021
Schooling · Highest qualification, residents 15 and over
Women and men · all residents
52.6% of Clarenville’s residents are women
Of the 2021 count, 3,525 were women and 3,180 men (women across Canada: 50.9%).
| Clarenville | Newfoundland and Labrador | Canada | |
|---|---|---|---|
| Under 15 | 16% | 13% | 16% |
| 15 to 64 | 62% | 61% | 64% |
| 65+ | 22% | 26% | 19% |
| No certificate, diploma or degree | 19% | 21% | 16% |
| Postsecondary qualification | 54% | 53% | 56% |
Statistics Canada, Census 2021; Newfoundland and Labrador and Canada: medians of towns of 2,500+
In and around Clarenville, 3 schools: 1 elementary school and 2 secondary schools
The nearest secondary school is 101 km away, above Newfoundland and Labrador’s towns (25 km) and Canadian towns (1.2 km) alike.
| School | Level | Students | System |
|---|---|---|---|
| Riverside ElementaryIn ClarenvilleElementary | Elementary | – | English public |
| Clarenville High SchoolIn ClarenvilleSecondary | Secondary | – | English public |
| Schools within 3 km | Clarenville | Newfoundland and Labrador | Canada |
|---|---|---|---|
| Nearest secondary school | 101 km | 25 km | 1.2 km |
Statistics Canada’s Open Database of Educational Facilities · Source note: the province publishes no results school by school, so there’s no schools grade in Newfoundland and Labrador.
Everything we know about Clarenville
Clarenville’s neighbours
The nearest places of 1,000 or more. Statistics Canada
| Town | People | km | Overall | Cost | Safety | Health |
|---|---|---|---|---|---|---|
| Clarenville | 7,441 | — | B− | B | B− | D |
| Division No. 7, Subdivision K | 1,116 | 9 | — | B+ | B− | D |
| Division No. 7, Subdivision L | 1,248 | 17 | — | B | B− | D− |
| Division No. 7, Subdivision M | 1,878 | 18 | — | A | B− | D− |
People: Statistics Canada, Census 2021. Distances: centre to centre.
Questions about Clarenville
Who are the people of Clarenville?
Visible minorities are 3% of the population, where the middle of Canadian towns is 15%. Immigrants make up 3%, and Indigenous people 3%.
Has Clarenville grown?
Yes: the census counted 6,291 in 2016 and 6,704 in 2021, a rise of 6.6%, against 4.1% for the median of Canadian towns. The 2025 estimate is 7,441.
How old are the people of Clarenville?
16% are under 15 and 22% are 65 or over.
What kind of homes are in Clarenville?
28% of households are one person, and the average is 2.3.
About Clarenville
Town in Newfoundland and Labrador
Every figure TownRatings gives for Clarenville covers the municipality as Statistics Canada maps it, one census subdivision in Newfoundland and Labrador.
Statistics Canada: population estimates 2025 (17-10-0155), Census of Population 2021, 2021 census boundaries.
- Population
- 7,441 (people, 2025 estimate)
- Province or territory
- Newfoundland and Labrador
- Census division
- Division No. 7
- Census subdivision
- 1007013
Sources: Statistics Canada, Census of Population 2021 · population estimates 2025 (17-10-0155) and 2021 census boundaries · Uniform Crime Reporting Survey 2023–25 (35-10-0026, 35-10-0183 to 35-10-0190) · CMHC rents as published by Statistics Canada (34-10-0133) · grades by TownRatings. Under the Statistics Canada Open Licence.
Adapted from Statistics Canada (Census of Population 2021, population estimates 2025, 2021 census boundaries) under the Statistics Canada Open Licence; this does not constitute an endorsement by Statistics Canada. Neighbourhood names in some cities © OpenStreetMap contributors (ODbL).