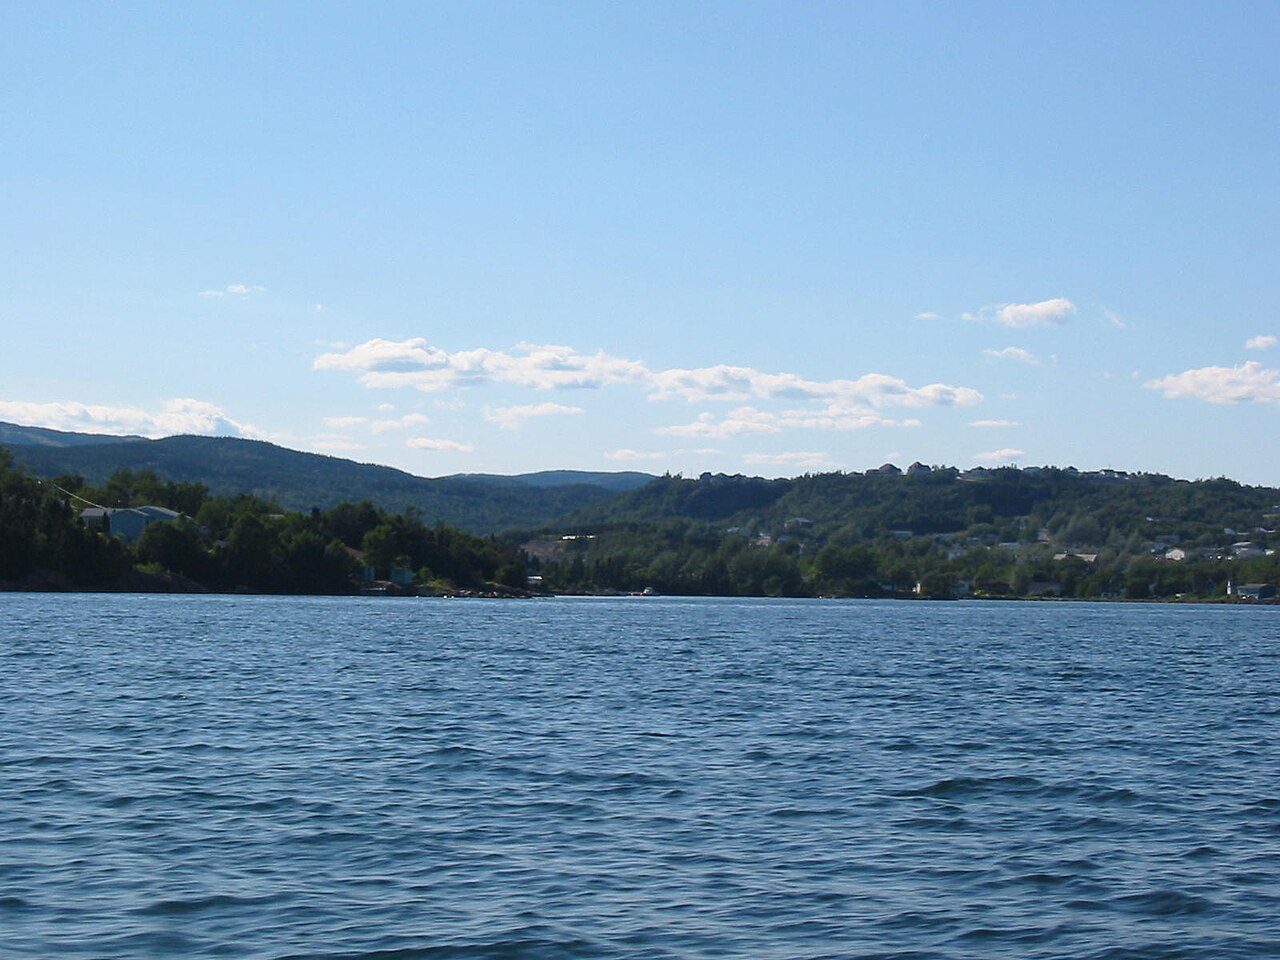
Home › Canada › Newfoundland and Labrador › Rankings › Least snow Marystown, #1 on this list · Photo: Jorshua59 at English Wikipedia (CC BY-SA 3.0) Newfoundland and Labrador · 2026 Towns with the least snow in Newfoundland and Labrador The places after the leader belong to Clarenville (229 cm) and Bonavista (229 cm). Halfway down the list sits Mount Pearl, at 363 cm. At the other end is Labrador City, with 459 cm. Across Canada, the same list puts Marystown #1,581 of 2,538. Canada’s top 100 on this list includes no place in Newfoundland and Labrador. Marystown tops the list in Newfoundland and Labrador, at 173 cm.
Snowfall a year, 1991–2020 normals at the nearest station that measures snow How grades work
#1 Newfoundland and Labrador · 5,196 people 173 cm Snowfall a year Overall D · #2,402 of 2,556
Strongest: hazard risk A , cost of living B · lowest: health D−
#2 Newfoundland and Labrador · 7,441 people 229 cm Snowfall a year Overall B− · #1,486 of 2,556
Strongest: hazard risk A+ , cost of living B · lowest: health D
#3 Newfoundland and Labrador · 3,293 people 229 cm Snowfall a year Overall C · #1,987 of 2,556
Strongest: hazard risk A+ , walkability B+ · lowest: health C−
All 31, ranked in Newfoundland and Labrador Best first in Newfoundland and Labrador; beside each place, its rank on the same list for all of Canada.
Every Newfoundland and Labrador list # Town Snowfall a year Canada rank What drives it
1 Marystown 5,196 people 173 cm #1,581 of 2,538 Strongest: hazard risk A , cost of living B · lowest: health D− 2 Clarenville 7,441 people 229 cm #2,158 of 2,538 Strongest: hazard risk A+ , cost of living B · lowest: health D 3 Bonavista 3,293 people 229 cm #2,159 of 2,538 Strongest: hazard risk A+ , walkability B+ · lowest: health C− 5 Placentia 3,374 people 321 cm #2,429 of 2,538 Strongest: hazard risk A , cost of living A · lowest: health D 6 Bay Roberts 6,407 people 321 cm #2,430 of 2,538 Strongest: hazard risk A , cost of living B · lowest: health D− 7 Spaniard's Bay 2,664 people 321 cm #2,431 of 2,538 Strongest: hazard risk A , cost of living B− · lowest: jobs & income D− 9 Holyrood 2,749 people 321 cm #2,433 of 2,538 Strongest: hazard risk A , cost of living C+ · lowest: health D− 10 Springdale 2,893 people 345 cm #2,486 of 2,538 Strongest: hazard risk A+ , safety B+ · lowest: jobs & income C− 11 Paradise 26,155 people 363 cm #2,494 of 2,538 Strongest: jobs & income A , hazard risk A · lowest: safety C 14 Torbay 8,297 people 363 cm #2,497 of 2,538 Strongest: hazard risk A , jobs & income A− · lowest: walkability C 15 Conception Bay South 29,725 people 363 cm #2,498 of 2,538 Strongest: hazard risk A , jobs & income B+ · lowest: safety C 16 Mount Pearl 24,266 people 363 cm #2,499 of 2,538 Strongest: hazard risk A , jobs & income B+ · lowest: cost of living C 17 St. John's 128,693 people 363 cm #2,500 of 2,538 Strongest: hazard risk A , walkability A · lowest: cost of living C− 18 Carbonear 5,041 people 363 cm #2,501 of 2,538 Strongest: hazard risk A , walkability B · lowest: jobs & income D 19 Harbour Grace 2,872 people 363 cm #2,502 of 2,538 Strongest: hazard risk A , cost of living B · lowest: jobs & income D 20 Stephenville 6,840 people 386 cm #2,526 of 2,538 Strongest: walkability A− , hazard risk B+ · lowest: safety D 21 Happy Valley-Goose Bay 8,197 people 406 cm #2,527 of 2,538 Strongest: hazard risk A+ , jobs & income A · lowest: safety D− 22 Corner Brook 20,549 people 408 cm #2,528 of 2,538 Strongest: hazard risk A− , walkability B+ · lowest: health C 23 Pasadena 3,930 people 408 cm #2,529 of 2,538 Strongest: hazard risk A− , cost of living A− · lowest: health D 24 Deer Lake 5,319 people 433 cm #2,531 of 2,538 Strongest: walkability A− , hazard risk A− · lowest: health D 25 Gander 12,707 people 443 cm #2,532 of 2,538 Strongest: hazard risk A , cost of living B+ · lowest: safety C− 26 Lewisporte 3,405 people 443 cm #2,533 of 2,538 Strongest: hazard risk A , cost of living B · lowest: health D 27 Botwood 2,884 people 443 cm #2,534 of 2,538 Strongest: hazard risk A , walkability B+ · lowest: jobs & income D 28 Grand Falls-Windsor 14,510 people 443 cm #2,535 of 2,538 Strongest: walkability B , cost of living B · lowest: hazard risk D 30 Bishop's Falls 3,162 people 443 cm #2,537 of 2,538 Strongest: cost of living B , walkability C+ · lowest: hazard risk D 31 Labrador City 7,965 people 459 cm #2,538 of 2,538 Strongest: jobs & income A+ , cost of living A+ · lowest: hazard risk D− Rankings
More lists for Newfoundland and Labrador Province by province
Least snow elsewhere Photos: Marystown, Jorshua59 at English Wikipedia (CC BY-SA 3.0 ) · Clarenville, Rioux Photography Edmonton, AB (Public domain ) · Bonavista, Yergoneby (CC BY-SA 4.0 ), via Wikimedia Commons.
Sources: TownRatings grades: our own summary of the data, ranking Canadian towns against each other only, run #73 of 10 November 2026. Under the Statistics Canada Open Licence.
Adapted from Statistics Canada (Census of Population 2021, population estimates 2025, 2021 census boundaries) under the Statistics Canada Open Licence; this does not constitute an endorsement by Statistics Canada. Neighbourhood names in some cities © OpenStreetMap contributors (ODbL).
 #1
 #2
 #3