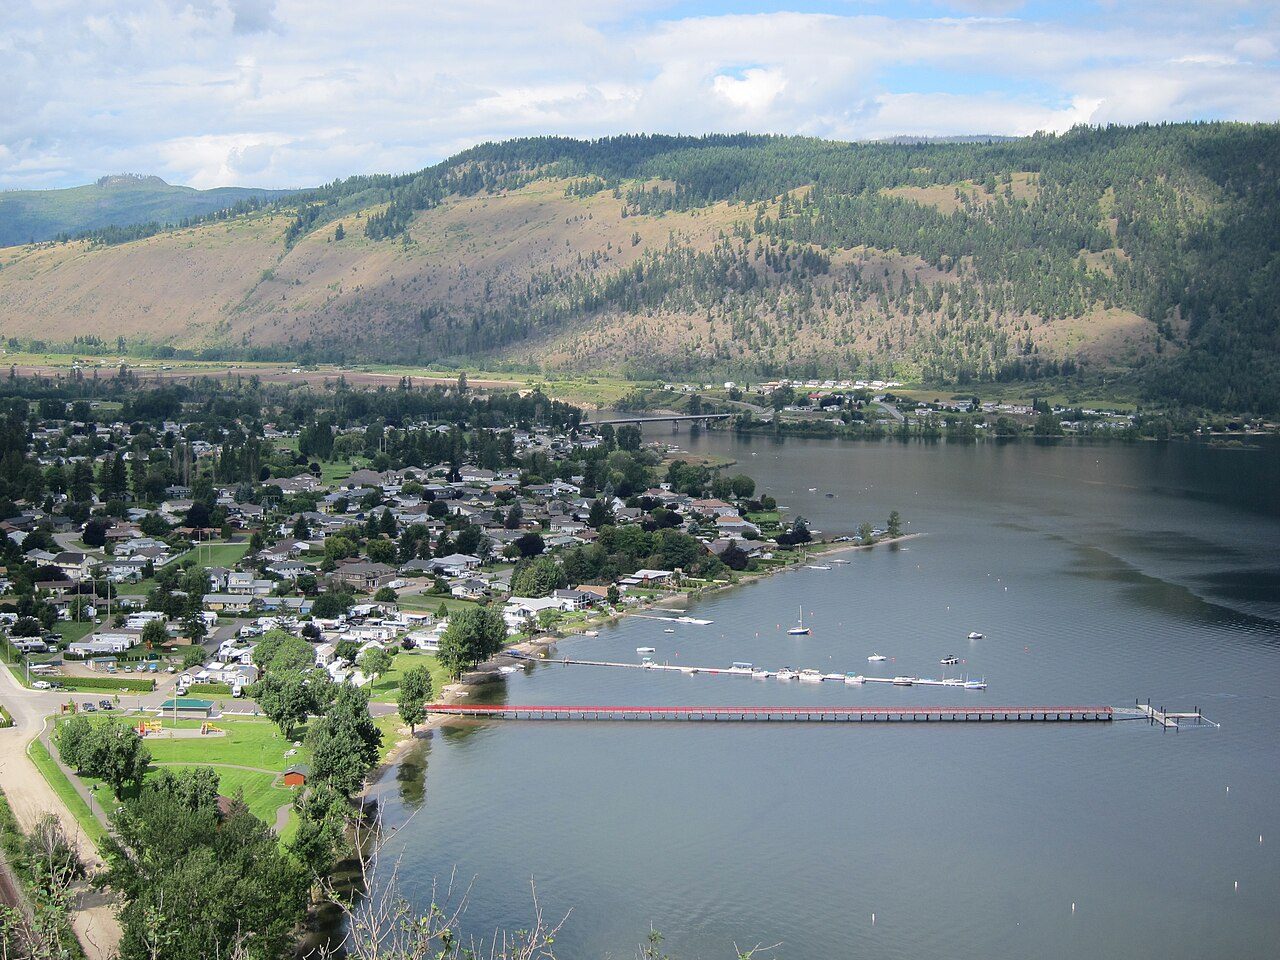
 Photo: The Interior · CC BY-SA 3.0
Chase sits 47% below British Columbia’s towns on home values
At the 2021 census the median home was worth $380,000, where British Columbia’s towns sit at $720,000. Treat the values as owners’ May 2021 guesses: they are self-reported, and they come from before rates went up. Statistics Canada counted 65 buyers in 2023, paying a median $520,000.
What Chase’s homes are worth, three ways
Three sources, each set against British Columbia’s towns only: provinces measure value differently, so they don’t line up across borders.
median, owners’ estimate
- Average
- $373K
- Owners
- 965
- British Columbia’s towns
- $720K
- The typical Canadian town
- $406K
median sale price
- Average sale
- $490K
- ÷ buyers’ income
- 4.1×
- Buyers
- 65
- British Columbia’s towns
- $682K
all residential
- British Columbia’s towns
- $671K
Census 2021 (Statistics Canada); Canadian Housing Statistics Program, tables 46-10-0099 and 46-10-0093; Québec rôle d’évaluation foncière 2026 (MAMH).
Chase’s detached houses are assessed 28% below the median of British Columbia’s towns
The 2024 assessment roll counts 960 homes in Chase, detached houses 80% of them.
Median assessment by type, 2024 the tick is the median of British Columbia’s towns
Canadian Housing Statistics Program, table 46-10-0093 (2024): residential properties on the assessment roll, vacant land left out. The ticks are the median of British Columbia’s towns with their own figure; assessments compare within a province only.
The homes of Chase, by period and type
At the 2021 census, 75% of Chase’s 1,175 occupied homes were single-detached houses. Half went up before 2001.
Homes by period of construction the tick is the median of British Columbia’s towns
Homes by kind
| Chase | British Columbia | Canada | |
|---|---|---|---|
| Condominiums | 7% | 10% | 8% |
| Needing major repairs | 6% | 6% | 6% |
| Too small for the household | 2% | 4% | 3% |
| Households in core housing need | 12% | 10% | 7% |
Census 2021 (Statistics Canada): occupied private dwellings; core housing need as Statistics Canada defines it. Ticks and columns are medians of the towns and neighbourhoods of 2,500 or more.
Chase against British Columbia’s towns: 47% under the $720,000 median
The census values of British Columbia’s towns, 254 of them with 2,500+ people, from dearest to cheapest.
Census 2021, owners’ estimates; towns and neighbourhoods of 2,500 or more, no city as a whole, no reserve.
Home values around Chase
Next to Chase: 2021 census values and the share of owners. Chase has few close neighbours with figures, so the list reaches 16–29 km out.
| Town | Median home value | Average | Owners | km |
|---|---|---|---|---|
| Chase | $380K | $373K | 83% | |
| Sun Peaks Mountain | $750K | $816K | 73% | 15.8 |
| Blind Bay | $600K | $626K | 90% | 22.6 |
| Electoral Area L (Grasslands), Thompson-Nicola | $600K | $634K | 85% | 25 |
| Electoral Area P (Rivers and the Peaks), Thompson-Nicola | $552K | $630K | 91% | 27.2 |
| Electoral Area F, Columbia-Shuswap | $420K | $522K | 90% | 28.7 |
Census 2021 values; km.
Questions about property prices in Chase
Is Chase expensive for British Columbia?
Cheaper than the middle: British Columbia’s towns come to $720,000, Chase to less.
How many households in Chase are in core housing need?
About as many as elsewhere: 12% of households in Chase, where British Columbia’s towns sit at 10%.
What is the average house price in Chase?
Homes sold for an average $490,000 in 2023; the median buyer paid 4.1 times their household income.
Can I see individual sales or prices by street?
No. Sales are published as town figures (median, average, buyers); street-level or single sales aren’t released.
Sources: Statistics Canada, Census of Population 2021 · Statistics Canada, Canadian Housing Statistics Program. Under the Statistics Canada Open Licence.
Adapted from Statistics Canada (Census of Population 2021, population estimates 2025, 2021 census boundaries) under the Statistics Canada Open Licence; this does not constitute an endorsement by Statistics Canada. Neighbourhood names in some cities © OpenStreetMap contributors (ODbL).