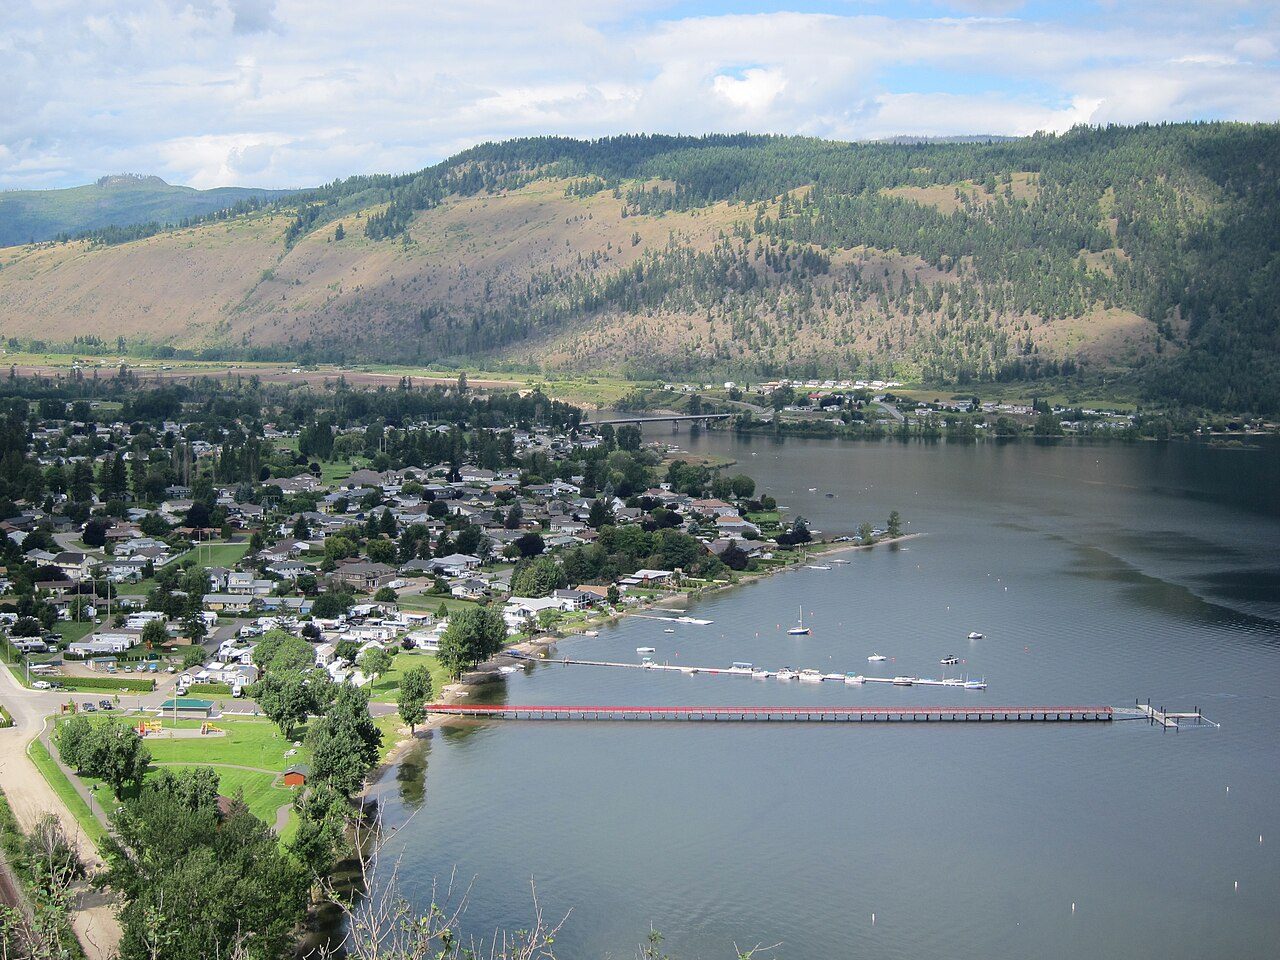
 Photo: The Interior · CC BY-SA 3.0
Measured against local pay, Chase costs more to live in than 95% of Canadian towns
With households earning a median $61,300, the median home’s value of $380,000 at the 2021 census comes to 6.2 years of income. Treat the values as owners’ May 2021 guesses: they are self-reported, and they come from before rates went up. For renters, a two-bedroom averaged $1,673 a month in October 2025; twelve months of that is 33% of the median household income. Chase doesn’t get its own two-bedroom rent figures; the ones here come from the Kamloops metro area. On that and its rents, Chase grades D− for cost of living (#117 of 253 in British Columbia and #2,082 of 2,580 Canadian towns).
What Chase’s housing numbers say
Rent is the heavy cost in Chase
A household on the local median of $61,300 would need more of it for a year of the two-bedroom rent ($1,673 a month) than in most towns. Renting ↓
Homes in Chase cost a lot against pay
The years of pay a home costs here run 32% past the typical Canadian town’s. Affordability ↓
Incomes sit below the province’s
Pay here runs 29% below the median of British Columbia’s towns, which makes homes and rents weigh more against income. Cost of living Grade ↓
Transport eats into budgets
On top of the 13% that housing takes, getting around costs a bigger share than in most towns, chiefly for driving. Housing and transport ↓
Each figure against the typical Canadian town of 2,500 or more: census 2021 values, CMHC or census rents, StatCan’s housing and transport index.
Chase grades D− for cost of living
The two measures the grade weighs, each against every one of the Canadian towns of 2,500 or more.
Neither measure is kind here: homes and rents both cost more of income than in the typical Canadian town.
Its place on cost of living: #117 of 253 in British Columbia and #2,082 of 2,580 Canadian towns.
Owning in Chase means 2.1 years less of household income than in British Columbia’s towns
Each figure over the median household income before tax in 2020: the home value from the 2021 census, and twelve months of rent. The comparisons are medians of the towns of 2,500 or more.
Years of household income for the median home
A year’s rent, share of household income
Rent weighs more as well, 8 points of income above British Columbia’s towns for a year of the two-bedroom rent.
Statistics Canada, Census 2021 (home values, household income, census rents); CMHC Rental Market Survey, October (two-bedroom rents where CMHC counts).
A two-bedroom rents for about $1,673 a month
Average rents in purpose-built buildings across Kamloops, October 2025; for two bedrooms that is about the same as the typical Canadian town ($1,598).
By size a month, the tick is the typical Canadian town
CMHC Rental Market Survey, October, via Statistics Canada table 34-10-0133: row and apartment buildings of three or more units.
Shelter stretches only 15% of households, where the typical town has 18%
Shelter costs (rent or mortgage, utilities, property tax and condo fees) against household income, census 2021.
Spending 30%+ of income on shelter the tick is the typical Canadian town
Statistics Canada, Census 2021: households spending 30% or more of total income on shelter costs.
Home and travel together: 34% of income, above the typical town
Statistics Canada’s Housing and Transportation Cost Index sets both against the median household income, in May 2024 dollars.
Housing and transport, share of income
Transport outweighs or matches housing: few households can do without a vehicle here.
Statistics Canada, Housing and Transportation Cost Index 2024 (tables 46-10-0090 and 46-10-0091).
83% of households own their home; 18% rent
Census 2021: households by whether they own or rent their home. Ownership runs above British Columbia’s towns, where the median is 76%.
Among towns its size, homes in Chase cost more years of pay (6.2×, against 3.7×)
Canadian towns of 2,500 to 3,497 people (422 of them), lowest home value against income first.
| Town | Median home value | Rent | ÷ income |
|---|---|---|---|
| Atikokan, Ontario A− | $100K | $705 | 1.5× |
| … | |||
| Tumbler Ridge, British Columbia A | $180K | $900 | 1.8× |
| Mackenzie, British Columbia B+ | $160K | $1,070 | 1.8× |
| … | |||
| Elkford, British Columbia A− | $300K | $1,140 | 2.5× |
| … | |||
| Houston, British Columbia A− | $224K | $775 | 2.7× |
| … | |||
| Electoral Area E, Peace River, British Columbia A− | $300K | $900 | 2.9× |
| … | |||
| Electoral Area D, Cariboo, British Columbia C | $300K | $1,455 | 3.5× |
| … | |||
| Lower Mount Royal, Calgary D | $348K | $1,908 | 6× |
| Sicamous, British Columbia D | $400K | $920 | 6.1× |
| City Commercial Core, Kitchener D | $420K | $1,816 | 6.2× |
| Chase D− | $380K | $1,673 | 6.2× |
| Rosedale, Hamilton D | $600K | $1,659 | 6.2× |
| Westwood, Edmonton D− | $302K | $1,598 | 6.2× |
| Leeming, Hamilton B− | $900K | $1,659 | 6.3× |
| … | |||
| Port Credit NHD (West), Mississauga D− | $1.4M | $2,045 | 18.1× |
Census 2021 values and 2020 incomes; rents from CMHC or the census.
Homes in Sun Peaks Mountain are valued $370K higher than in Chase
The places around Chase: home value at the 2021 census, rent, and value over income. Chase has few close neighbours with figures, so the list reaches 16–29 km out.
| Town | Grade | Median home value | Rent | ÷ income |
|---|---|---|---|---|
| Chase | D− | $380K | $1,673 | 6.2× |
| Sun Peaks Mountain (16 km) | D− | $750K | $1,673 | 8.7× |
| Blind Bay (23 km) | D | $600K | $1,000 | 8.1× |
| Electoral Area L (Grasslands), Thompson-Nicola (25 km) | D | $600K | $1,000 | 7.4× |
| Electoral Area P (Rivers and the Peaks), Thompson-Nicola (27 km) | D | $552K | $1,673 | 5.9× |
| Electoral Area F, Columbia-Shuswap (29 km) | D | $420K | $850 | 6.4× |
Values: census 2021. Rent: CMHC or census.
What this data can and can’t tell you
- Rents. Only purpose-built rentals of three or more units are in CMHC’s survey, so a basement suite or a rented condo doesn’t count.
- Income is the town’s own. Incomes are a year older than the values: 2020, a year of emergency benefits, before tax.
- Housing and transport. These shares are the newest figures on the page, for 2024, from a Statistics Canada model rather than a count.
- Property tax. No open figure for property tax by municipality is published in British Columbia, so Chase has none here.
- Compared with what. Comparisons use the middle town of 2,500+ across Canada and the middle one among British Columbia’s towns; reserves and whole cities aren’t in either.
Questions about living costs in Chase
What does owning a home cost each month in Chase?
At the 2021 census, half of owners paid more than $596 a month for shelter, counting the mortgage, taxes, fees and utilities.
How much is rent in Chase?
From $1,345 for one bedroom to $1,913 for three, with $1,673 for two: CMHC’s averages for October 2025.
What do households in Chase earn?
The median household income was $61,300 before tax in 2020, below Canada’s towns ($85,900); for British Columbia’s towns it is $86,900.
Is Chase expensive to live in?
Not on homes: British Columbia’s towns sit at 8.3 years of income for the median home, and this town below them.
Sources: Statistics Canada, Census of Population 2021 · CMHC Rental Market Survey (Statistics Canada table 34-10-0133) · Statistics Canada, Housing and Transportation Cost Index 2024. Under the Statistics Canada Open Licence.
Adapted from Statistics Canada (Census of Population 2021, population estimates 2025, 2021 census boundaries) under the Statistics Canada Open Licence; this does not constitute an endorsement by Statistics Canada. Neighbourhood names in some cities © OpenStreetMap contributors (ODbL).