
Wood Pond, 2012
Kenwood’s story
133 years in pictures
The archive holds 3 old photos and papers going back to 2012 and 5 maps from 1916 on.
- 1893Kenwood is settled
Each edition grades its towns against each other only.

A town settled in 1893, now home to 1,028 people.
The best of Kenwood’s subject grades are an A+ for walkability and an A for health; the weakest is a D− for hazard risk. 65% of adults 25 and older hold a bachelor’s degree or more in Kenwood, above both the California town median (29%) and the median of U.S. towns (29%). On hazard risk, just 52 of California’s 1,064 towns do worse. The typical home is worth about $1.3 million, 12 years of the Santa Rosa metro’s $105K median household income. Kenwood has fewer than 2,500 residents, so it gets subject grades but no overall grade.
Where Kenwood beats most towns, and one thing worth knowing.
1,028 counted in 2010 and 852 in 2020.
U.S. Census 2010 & 2020 counts
Each subject compared with towns across the country (schools within California), ordered by how far Kenwood is from typical.
How TownRatings grades towns →
The archive holds 3 old photos and papers going back to 2012 and 5 maps from 1916 on.
Museums, parks, gardens and other places to visit around Kenwood. Close and well known come first.
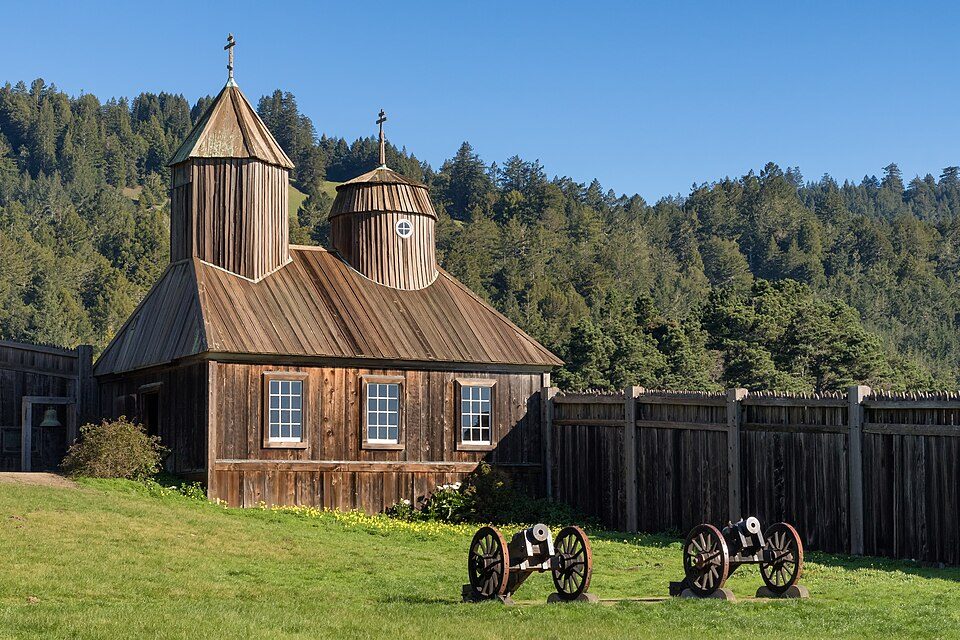 39 mi Ancient siteFort Ross
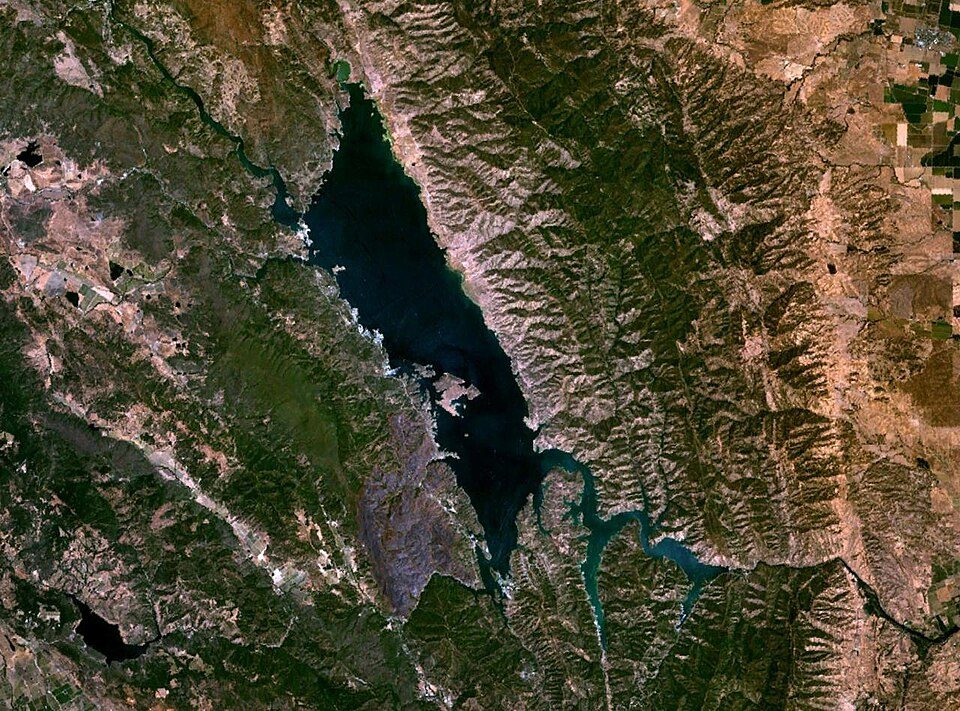 20 mi LakeLake Berryessa
 35 mi National MonumentMuir Woods National Monument757K visitors a year
 26 mi Theme parkSix Flags Discovery Kingdom
 34 mi MountainMount Tamalpais
 11 mi MuseumCharles M. Schulz Museum and Research Center
Fort Ross: Frank Schulenburg, CC BY-SA 4.0 · Lake Berryessa: Unknown, Public domain · Muir Woods National Monument: Unknown, CC BY-SA 3.0 · Six Flags Discovery Kingdom: Tinned Elk, CC BY-SA 3.0 · Mount Tamalpais: Originally uploaded by Nelso (Transferred by DimiTalen), CC BY-SA 3.0 · Charles M. Schulz Museum and Research Center: BrokenSphere, CC BY-SA 3.0
Kenwood is unincorporated, so Sonoma County and regional agencies provide most services.
EPA SDWIS (Oct 9, 2026) · HIFLD + EIA-861 2025 · Census 2020 ZCTAs · NCES 2024–25 · registration: vote.gov, updated Nov 18, 2024.
Ordered by what stands out in Kenwood.
Typical home values fell 2.1% in the year to September 2026. Among households in Kenwood, 76% live in a home they own.
Census ACS, 2020–24 · Zillow Home Value Index · Redfin Data Center
Public schools: the Kenwood school district. Its one school is below. Enrollment at the town’s public school: 124 students.
| School | Level | Students | Letter |
|---|---|---|---|
| Kenwood ElementaryLargest public elementary schoolGrades K–6 | Grades K–6 | 124 | – |
NCES · EDFacts · graded within CA on state tests and graduation
In Kenwood, 6.7% of residents live below the poverty line. Just 4% of the town’s working residents have a job in town. For Kenwood, the average trip to work is 54 minutes. Between 2013 and 2023, jobs in Kenwood dropped by 69, to 446.
| Kenwood | California towns | U.S. towns | |
|---|---|---|---|
| Average trip to work | 54 minutes | 28 minutes | 25 minutes |
| Below the poverty line | 6.7% | 10% | 9.6% |
| Median household income | $100,000 | $95,000 | $80,000 |
| Working residents who work in town | 3.6% | 6.6% | 8% |
Census LEHD 2023 · ACS
Federal disaster aid has reached households in Kenwood after 3 declared disasters, most recently in 2020. Expected storm and flood damage is higher than in 97% of U.S. communities. FEMA puts 65% of the town’s expected hazard losses down to inland flooding, and 23% to earthquakes.
FEMA disaster declarations and aid · FEMA National Risk Index · OpenFEMA
For adults 18 to 64 in Kenwood, the share who have no health insurance is 3.9%. Against the California average, Kenwood comes out ahead on 19 CDC measures out of 32, and behind on 7. In Kenwood, 13% of adults report frequent mental distress, and 24% have obesity.
| Kenwood | California towns | U.S. towns | |
|---|---|---|---|
| Feel lonely (CDC PLACES) | 27% | 36% | 33% |
| Frequent mental distress (CDC PLACES) | 13% | 17% | 17% |
| Obesity (CDC PLACES) | 24% | 29% | 35% |
| Binge drink (CDC PLACES) | 13% | 16% | 16% |
| What stands out | Kenwood | CA |
|---|---|---|
| Fewer uninsured adults | 3.9% | 10.6% |
| Fewer adults facing food insecurity | 7% | 17.9% |
| More adults who have had cancer | 13.6% | 6.4% |
CDC PLACES 2025 · modeled estimates for adults · CMS · HRSA
July afternoons reach 85°, January nights drop to 39° and snow is almost unheard of.
NOAA U.S. Climate Normals, 1991–2020
1.5 miles of trail in 3 parks and preserves. For Kenwood, the density of trails is 0.3 miles per square mile. Parks and preserves in the town: 3, covering 8 acres.
| Kenwood | California towns | U.S. towns | |
|---|---|---|---|
| Conserved land | 9.5% | 4.3% | 4.3% |
| Miles of trail per square mile | 0.3 miles per square mile | 1.0 | 0.4 |
| Biggest places to walk | Trails | Acres |
|---|---|---|
| 1. Alder Park | — | 4 |
| 2. Shaw Park | 0.1 mi | 3 |
| 3. Sugarloaf Ridge State Park | — | 1 |
Trails & parks © OpenStreetMap contributors · Conserved land: USGS PAD-US
3 within 15 miles of the center of Kenwood
About 9 of every 100 Kenwood residents are enrolled in college, about the same as California.
In a town this size, neighbors are the best guide. Ask them anything.
Unincorporated community in California, United States
Kenwood is an unincorporated community and census-designated place (CDP) in Sonoma County, California, United States, located on Sonoma Highway (State Route 12) between the cities of Santa Rosa and Sonoma. It lies east of Sonoma Creek in the upper part of Sonoma Valley, a region sometimes called the Valley of the Moon. Bennett Mountain lies west of the town, and Sugarloaf Ridge to the northeast. The population was 852 at the 2020 census. Kenwood is considered part of the Wine Country. Viticulturally, it lies in the Sonoma Valley AVA. The Kenwood area is known for vineyards and wineries, restaurants, and a European-style resort. An area landmark is the Kunde Estate Winery on Sonoma Highway, …
From Wikipedia, licensed CC BY-SA 4.0 · facts via Wikidata (CC0)
Short answers, built from the data on this page.
Yes. Cost of living, which also weighs rents, property taxes and how many households pay 30% or more of their income for housing, grades D−.


