
Bonneville Dam site, May 17, 1934, 10:35 A.M, 1934
North Bonneville’s story
92 years in pictures
The archive holds 6 old photos and papers going back to 1934.
- 1934North Bonneville is settled
Each edition grades its towns against each other only.

North Bonneville’s best subject grades are an A− for health and an A for the outdoors; its weakest is a D for hazard risk. On cost of living, just 10 of Washington’s 395 towns do better. North Bonneville's public schools trail 72% of Washington towns on state tests and graduation. North Bonneville’s trail network density is 2.0 miles per square mile, above both the Washington town median (0.8) and the median of U.S. towns (0.4). The biggest park or preserve is Pierce National Wildlife Refuge, at 252 acres. North Bonneville has fewer than 2,500 residents, so it gets subject grades but no overall grade.
Where North Bonneville beats most towns, and one thing worth knowing.
In a town this size, neighbors are the best guide. Ask them anything.
Each subject compared with towns across the country (schools within Washington), ordered by how far North Bonneville is from typical.
How TownRatings grades towns →
The archive holds 6 old photos and papers going back to 1934.
Who provides power, water and the rest in North Bonneville, and how to reach them.
EPA SDWIS (Oct 9, 2026) · HIFLD + EIA-861 2025 · Census 2020 ZCTAs · NCES 2024–25 · registration: vote.gov, updated Sep 30, 2026.
Ordered by what stands out in North Bonneville.
Expected storm and flood damage is higher than in 87% of U.S. communities. Of the losses FEMA expects in North Bonneville, 69% come from inland flooding and 20% from cold waves. One declared disaster, in 2025, has brought federal aid to North Bonneville households.
FEMA disaster declarations and aid · FEMA National Risk Index · OpenFEMA
Among adults in North Bonneville, 71% had a checkup this year. The town does better than the Washington average on 2 of 31 CDC measures and worse on 1. In North Bonneville, 17% of adults get no exercise outside work, and 18% binge drink.
| North Bonneville | Washington towns | U.S. towns | |
|---|---|---|---|
| Yearly checkup (CDC PLACES) | 71% | 71% | 79% |
| Get no exercise (CDC PLACES) | 17% | 18% | 25% |
| Binge drink (CDC PLACES) | 18% | 17% | 16% |
| Food insecurity (CDC PLACES) | 8.2% | 10% | 14% |
| What stands out | North Bonneville | WA |
|---|---|---|
| Fewer adults facing food insecurity | 8.2% | 10.2% |
| Fewer adults without reliable transportation | 6.4% | 7.2% |
| More adults who have had cancer | 8.9% | 7.9% |
CDC PLACES 2025 · modeled estimates for adults · CMS · HRSA
Half commute less than 33 miles. Since 2013, North Bonneville has added 112 jobs, to 208 in 2023. For most workers, North Bonneville is a place to come home to: only 3% work in town. North Bonneville: 4.6% of residents live below the poverty line.
| North Bonneville | Washington towns | U.S. towns | |
|---|---|---|---|
| Below the poverty line | 4.6% | 7.9% | 9.6% |
| Median household income | $100,000 | $98,000 | $80,000 |
| Work from home | 11% | 15% | 11% |
| Working residents who work in town | 3.4% | 4.9% | 8% |
Census LEHD 2023 · ACS
For North Bonneville, the peak summer temperature is 82°F.
NOAA U.S. Climate Normals, 1991–2020
Across 7 parks and preserves: 5.7 miles of trail.
| Biggest places to walk | Trails | Acres |
|---|---|---|
| 1. Hamilton Island Recreation Area | 1.6 mi | 85 |
| 2. Gifford Pinchot National Forest | 0.5 mi | 17 |
| 3. Fort Cascades Trail | 0.3 mi | 10 |
Trails & parks © OpenStreetMap contributors · Conserved land: USGS PAD-US
In the year to September 2026, typical home values climbed 1.9%. 63% of households own their home in North Bonneville. For North Bonneville, the median rent is $1,043 a month.
| North Bonneville | Washington towns | U.S. towns | |
|---|---|---|---|
| Median rent | $1,043 a month | $1,739 a month | $1,185 a month |
| Households that own their home | 63% | 71% | 73% |
Census ACS, 2020–24 · Zillow Home Value Index · Redfin Data Center
Museums, parks, gardens and other places to visit around North Bonneville. Close and well known come first.
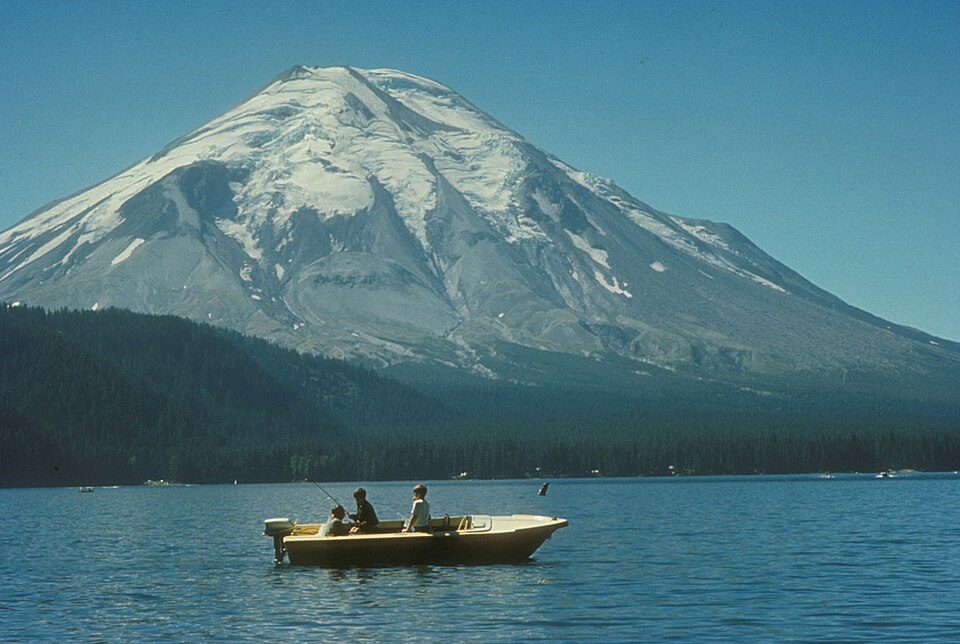 Big draw40 mi MountainMount St. Helens
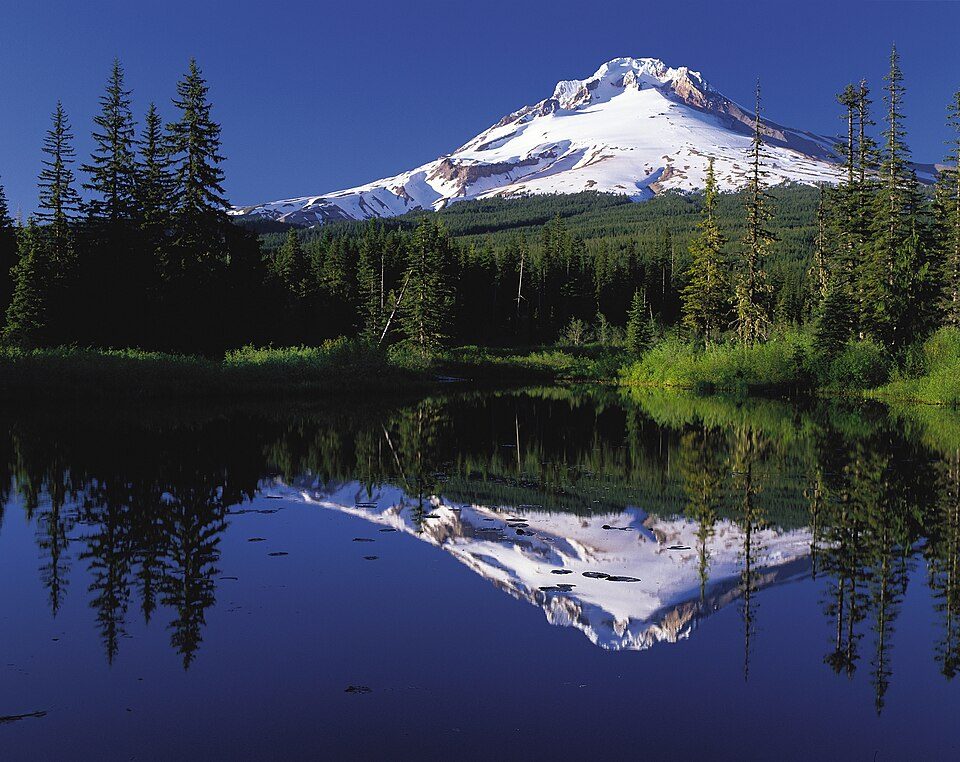 Big draw23 mi MountainMount Hood
 8 mi WaterfallMultnomah Falls
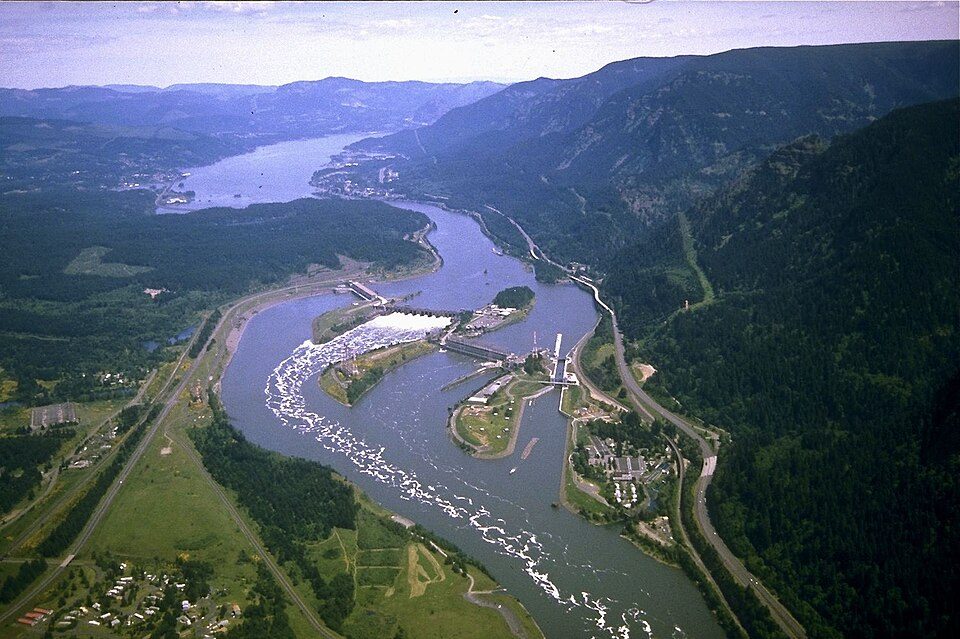 2 mi DamBonneville Dam
 10 mi Canyon & gorgeColumbia River Gorge
 34 mi Stadium & arenaModa Center
Mount St. Helens: U.S. Forest Service- Pacific Northwest Region, Public domain · Mount Hood: Oregon's Mt. Hood Territory., Public domain · Multnomah Falls: John Fowler from Placitas, NM, USA, CC BY 2.0 · Bonneville Dam: U.S. Army Corps of Engineers, Public domain · Columbia River Gorge: Hux, Public domain · Moda Center: Lugnuts, CC BY-SA 3.0
None within 15 miles of North Bonneville; the nearest are
About 3 of every 100 North Bonneville residents are enrolled in college, against 6 across Washington.
Where North Bonneville’s working residents go each day. Line width shows the share.
Census LEHD 2023
City in Washington, United States
North Bonneville is a city along the Columbia River in Skamania County, Washington, United States. The population was 1,397 at the 2020 census. It lies within the Columbia River Gorge National Scenic Area on the north side of Bonneville Dam complex. The city was originally developed to house the dam's construction workers in the 1930s and later relocated from its original site in the 1970s to accommodate new dam facilities.
From Wikipedia, licensed CC BY-SA 4.0 · facts via Wikidata (CC0)
Short answers, built from the data on this page.
Not for the area. That is 4.9 years of the area's median household income ($97,436 across the Portland-Vancouver-Hillsboro, OR-WA metro area). Cost of living, which also weighs rents, property taxes and how many households pay 30% or more of their income for housing, grades A−.


