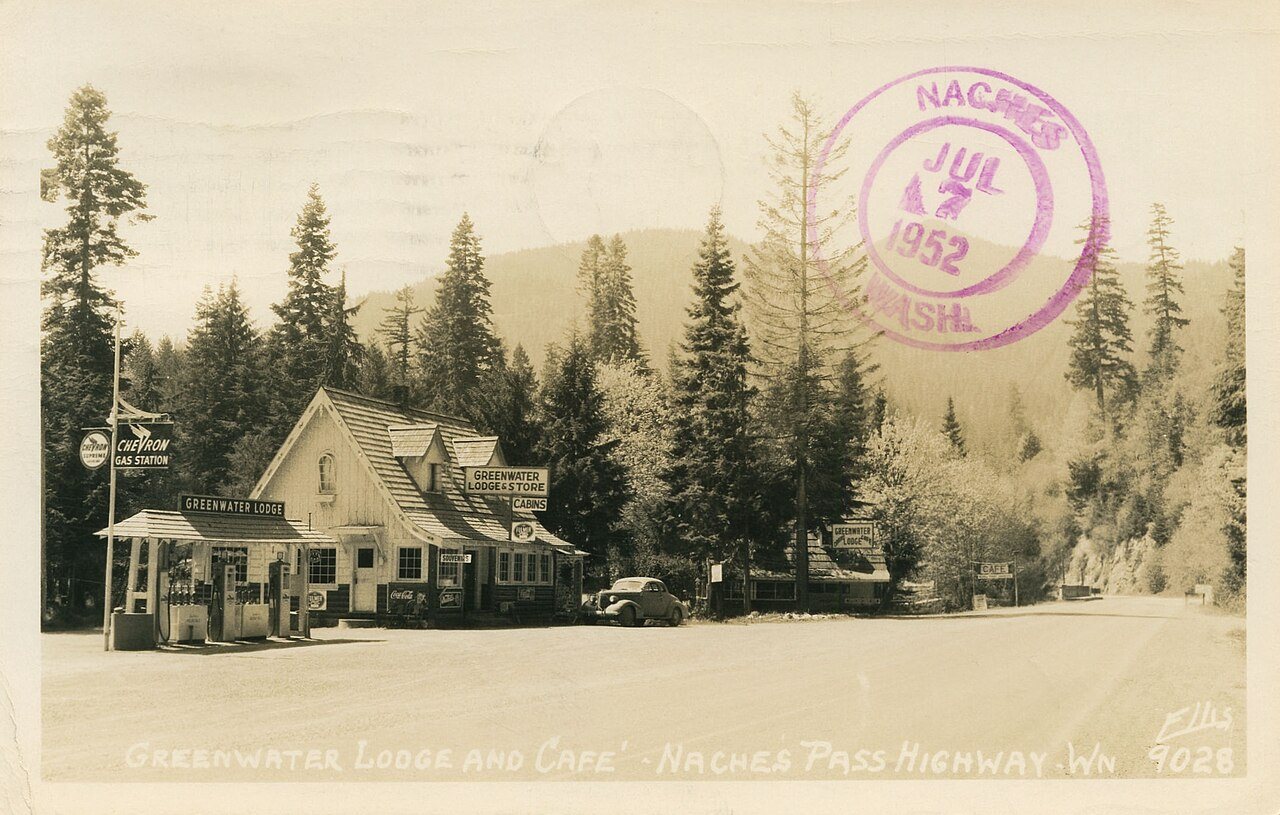
Greenwater in pictures
Census counts: 91 in 2000, 95 in 2020. The archive holds 12 old photos and papers going back to 2012 and 2 maps from 1956 on.
Explore the history →Each edition grades its towns against each other only.

59 people live in this town in Washington.
100% of adults 25 and older hold a bachelor’s degree or more in Greenwater, against 30% in Washington’s towns and 29% across U.S. towns. Among 286 Washington towns, just one has a higher share of homes lived in by their owners than Greenwater. Greenwater has fewer than 1,000 residents, too few for fair grades; the figures below are still real.
In a town this size, neighbors are the best guide. Ask them anything.
Census counts: 91 in 2000, 95 in 2020. The archive holds 12 old photos and papers going back to 2012 and 2 maps from 1956 on.
Explore the history →Greenwater is unincorporated, so Pierce County and regional agencies provide most services.
EPA SDWIS (Oct 9, 2026) · HIFLD + EIA-861 2025 · Census 2020 ZCTAs · NCES 2024–25 · registration: vote.gov, updated Sep 30, 2026.
Ordered by what stands out in Greenwater.
Greenwater’s risk rating from FEMA comes in at 88 of 100. Expected losses in Greenwater break down as 70% from avalanches and 16% from inland flooding.
FEMA National Risk Index · OpenFEMA
For half of commuters, work is under 37 miles away. The top destinations are Seattle (15%), Tacoma (9%) and Federal Way (8%).
Census LEHD 2023 · ACS
NOAA U.S. Climate Normals, 1991–2020
Just over a third of adults sleep under 7 hours in Greenwater. Against the Washington average, Greenwater comes out ahead on 7 CDC measures out of 31, and behind on 6. Among adults in the town, 6.1% worry about having enough food and 39% have obesity.
| Greenwater | Washington towns | U.S. towns | |
|---|---|---|---|
| Yearly checkup (CDC PLACES) | 73% | 71% | 79% |
| Food insecurity (CDC PLACES) | 6.1% | 10% | 14% |
| Obesity (CDC PLACES) | 39% | 33% | 35% |
| Depression (CDC PLACES) | 27% | 26% | 23% |
| What stands out | Greenwater | WA |
|---|---|---|
| Fewer adults facing food insecurity | 6.1% | 10.2% |
| Fewer adults without reliable transportation | 4.7% | 7.2% |
| More adults with arthritis | 31.9% | 24.4% |
CDC PLACES 2025 · modeled estimates for adults · CMS · HRSA
None within 15 miles of Greenwater; the nearest are
College town 17 of every 100 Greenwater residents are enrolled in college, against 6 across Washington.
Where Greenwater’s working residents go each day. Line width shows the share.
Census LEHD 2023
CDP in Washington, United States
Greenwater is a census-designated place (CDP) in the northwest United States in Pierce County, Washington. Southeast of Seattle, the population was 67 at the 2010 census, down from 91 in 2000. At the 2020 census, the population was 95. Based on per capita income, Greenwater ranks 17th of 522 areas in the state of Washington to be ranked, and is the highest in Pierce County. East of Enumclaw on Highway 410, Greenwater gains much of its popularity as a town for hikers and skiers on their way south to Mount Rainier National Park and Crystal Mountain ski area. Three popular campgrounds reside in Greenwater: Silver Springs, The Dalles, and Buck Creek.
From Wikipedia, licensed CC BY-SA 4.0 · facts via Wikidata (CC0)
Short answers, built from the data on this page.
Greenwater has fewer than 1,000 residents, too few for fair grades; the figures below are still real. 59 people live in this town in Washington.