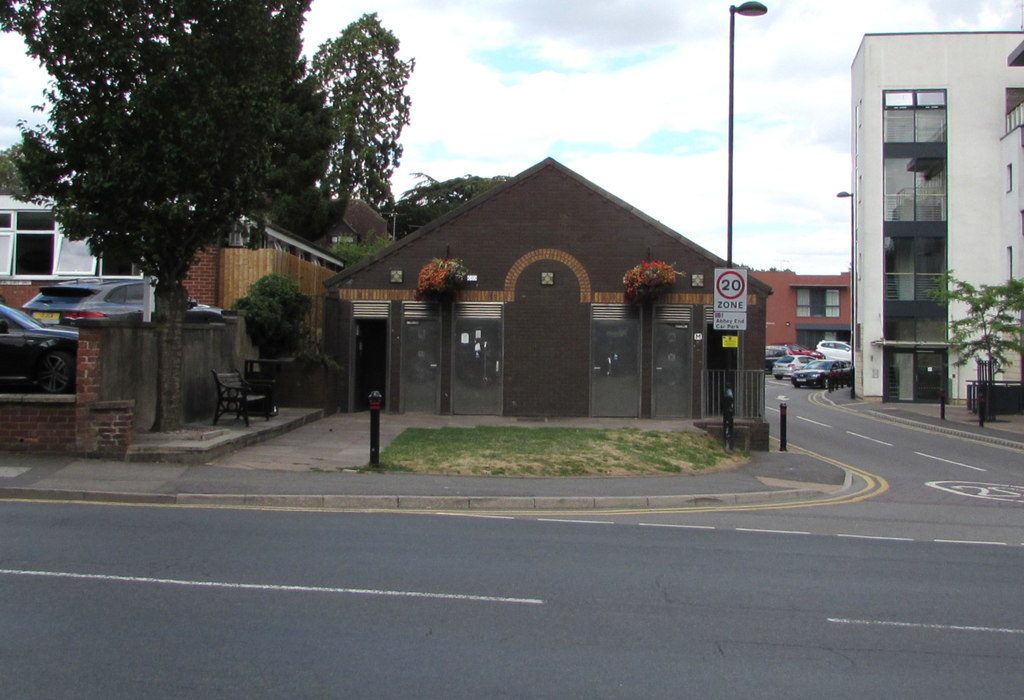
 Photo: Jaggery · CC BY-SA 2.0
Half of Kenilworth is over 48.2, older than 75% of UK towns
Married adults and civil partners make up 54%, against 44% across England’s towns. More households in flats than in 71% of UK towns: 15%. Kenilworth’s 9,885 households held 22,239 residents at the 2021 Census. A quarter of households have dependent children.
Since 2011, Kenilworth has changed by +2%, slower than 76% of UK towns
ONS mid-year estimates, each year indexed to mid-2011 = 100. Kenilworth’s figure is the small areas (2021 LSOAs) that make up the town.
People, mid-2011 = 100
Change by age, 2011 to 2024
About 21,900 people in 2011; 22,300 in 2024.
The biggest jump came in the year to mid-2021: 290 more people. Change by age ran from +23% for the 65 and over to −6% for the 30 to 44.
26% of Kenilworth is 65 or over, a higher share than 79% of UK towns
Share of residents in each five-year age band, Census 2021.
More residents are 55–59 than any other five-year age: 7.8% of residents. The wider picture: 18% of residents are 65 or over across England’s towns. In Bulkington, the oldest of Warwickshire’s towns by this measure, it is 35%.
Median age of UK towns of 2,500+
■ Kenilworth, 48.2. The typical town is 44.4.
Broad ages · share of residents
Women and men · all residents
51% women, 49% men
About 95 men for every 100 women. Across England, 51% of residents are women.
A student town: 6.7% of adults study full-time
What adults did at the 2021 Census (the ONS’s NS-SEC classes), and where residents lived a year earlier.
Adults by occupation class · residents 16 and over
Address a year before the Census
Residents who lived somewhere else a year earlier. The bar runs to 25%.
Across England’s towns, 33% of adults are in managerial and professional jobs and 24% in routine work; in Kenilworth, 50% and 14%. As a reference point, 7.9% of adults are full-time students across England’s towns. Residents who moved in within the year account for 9.8%.
The Census was taken on 21 March 2021, in term time, so students were counted at their term addresses.
Smaller households than 67% of UK towns: 2.2 people on average
Household make-up at the 2021 Census. Each square is 1% of households.
Against Warwickshire’s towns and England’s towns
People per household
England’s towns.
Shared households of unrelated adults make up 2.5%, against 4.3% across England’s towns. Few places have as many one-person households: 31% here, more than in three fifths of UK towns.
35% of households live in a detached house, a share 65% of UK towns don’t reach
Accommodation type and cars or vans per household, Census 2021. Owning and renting are on Cost of living.
Type of home
Cars or vans · share of households
Compared with 24% across England’s towns, 17% of households live in a terraced house here. Kenilworth has fewer households without a car or van than just over three fifths of UK towns, at 13%. Measured more widely, 21% of households live in a detached house across England’s towns.
Residents born outside the UK make up 10% in Kenilworth, more than in 74% of UK towns
Country of birth, year of arrival and main language, Census 2021.
Born outside the UK, by region · share of all residents; the bar runs to 25%
When those born abroad arrived
Main language · residents aged 3 and over
Where 21% of those born abroad across England’s towns arrived in 2017 or later, here the share is 22%. For comparison, 18% of residents were born outside the UK across England’s towns. The census found that 96% of residents have English as their main language in Kenilworth.
87% of residents describe themselves as White British, below 75% of UK towns
How residents described themselves at the 2021 Census. Lines join the lowest and highest of the three figures.
Ethnic groups other than White British · all residents
White British, not charted: 87% of Kenilworth · Warwickshire’s towns 81% · England’s towns 73%.
Religion · all residents
Half of residents describe themselves as Christian; across England’s towns the figure is 46%. The largest groups after White British are Other White (5.8%), Mixed or multiple (2.3%) and Indian (2.1%). Across England’s towns, the share of residents who describe themselves as White British is 73%.
A lower share of adults who have never married than 81% of UK towns, at 28%
Legal partnership status (residents 16 and over) and unpaid care (residents 5 and over), Census 2021.
Partnership status · residents 16 and over
Unpaid care given · share of residents 5 and over
Unpaid care takes 50 hours a week or more for 444 people. The share of adults who have never married across England’s towns is 39%. On unpaid carers, Kenilworth sits lower than 69% of UK towns: 8.7%.
50% of adults are qualified to degree level
Highest qualification, residents 16 and over, Census 2021.
Highest qualification · residents 16 and over
In Kenilworth, 50% of adults hold a degree-level qualification, against 34% across England’s towns, while 11% have no qualification at all (18%). For 15%, A levels are the highest qualification so far, many of them students still working towards a degree.
From a median age of 47 in Kenilworth West to 50 in Kenilworth South
The town’s 3 neighbourhoods (ONS middle-layer areas with 500+ residents inside it, named by the House of Commons Library), youngest first. Census 2021.
Kenilworth South is the oldest area, with 29% aged 65 or over; Kenilworth West the youngest (median age 47). Families with children are most common in Kenilworth East (27% of households).
Among 267 UK towns of 16,000 to 30,000 people, the 28th oldest
Median age, Census 2021. Hover a dot for its students and residents born abroad; click for its page.
Bangor is the youngest (26.4); Brixham the oldest (55.6). Nearest to Kenilworth in age: Biddulph (48.2), Knowle and Dorridge (48.2), Longfield, New Ash Green and Hartley (48.2) and Crowborough (48.2).
Among its 7 nearest neighbours, 1 are older than Kenilworth
Nearby built-up areas coloured by median age, Census 2021. Tap a town for its page.
| Town | People | Away | Median age | 65+ | Homes with children |
|---|---|---|---|---|---|
| Kenilworth | 22,239 | — | 48.2 | 26% | 25% |
| Leek Wootton | 1,003 | 1.8 mi | 51.1 | 27% | 29% |
| Burton Green | 1,556 | 2.6 mi | 46.7 | 24% | 30% |
| Cubbington | 3,895 | 3.7 mi | 47.7 | 27% | 28% |
| Hatton | 1,953 | 3.9 mi | 42 | 11% | 39% |
| Royal Leamington Spa | 51,321 | 4.2 mi | 36.3 | 16% | 24% |
| Warwick | 36,673 | 4.2 mi | 39.2 | 17% | 31% |
| Balsall Common | 7,094 | 4.5 mi | 48.2 | 25% | 29% |
Health, work and homes have their own pages
What this data can and can’t tell you
- The Census was taken in a lockdown, in term time. 21 March 2021 fell in term time, and students were asked to give their term-time address, so most were counted where they study. Some may have been living with family that day.
- “Warwickshire’s towns” and “England’s towns” mean their built-up areas. Census comparisons pool every built-up area in Warwickshire (or England), summed the same way as Kenilworth’s figures, so households in open countryside are left out. The population trend compares with the whole county and nation.
- Estimates since 2021 are modelled. The ONS builds mid-year estimates from the Census, births, deaths and migration records. Kenilworth’s trend uses the small areas (2021 LSOAs) with most of their people inside it: 22,039 people in 2021, against 22,239 in the built-up area.
- Small counts are blurred. The ONS adds small random changes to Census counts to protect privacy, so the same total differs a little between tables, and the shares of a small town can move by a point or two.
Questions about Kenilworth’s residents
What is the population of Kenilworth?
The 2021 Census counted 22,239 people in Kenilworth’s built-up area. The ONS estimates the same small areas held 22,300 people in mid-2024, 2% more than in 2011.
What is the average age in Kenilworth?
The median age was 48.2 at the 2021 Census, older than 75% of UK towns. 9.7% of residents were 15 to 24 and 26% were 65 or over.
How diverse is Kenilworth?
87% of residents described themselves as White British in 2021, against 73% across England’s towns and 81% across Warwickshire’s towns. 10% were born outside the UK.
What religion are people in Kenilworth?
40% said they had no religion and 50% that they were Christian at the 2021 Census; 0.8% were Muslim and 5.8% didn’t answer.
Is Kenilworth good for families?
25% of households had dependent children in 2021, against 29% across England’s towns. Families are most common in Kenilworth East (27% of households). Schools are on Kenilworth’s schools page.
Sources: ONS Census 2021, output areas summed to the ONS 2022 built-up area (TS002, TS003, TS004, TS007A, TS008, TS015, TS017, TS019, TS021, TS029, TS030, TS039, TS044, TS045, TS062, TS067) · ONS mid-year population estimates for 2021 LSOAs, mid-2011 to mid-2024 · House of Commons Library MSOA names. All under the Open Government Licence v3.0.
Contains public sector information licensed under the Open Government Licence v3.0. Contains HM Land Registry data © Crown copyright and database right 2026. Contains OS data © Crown copyright and database right 2026 (ONS boundaries). Northern Ireland: Source: NISRA; contains Land & Property Services data and Ordnance Survey of Northern Ireland information, © Crown copyright, licensed under the Open Government Licence v3.0. Scotland: contains National Records of Scotland data, Registers of Scotland data and SEPA data, © Crown copyright / © SEPA 2025, licensed under the Open Government Licence v3.0.