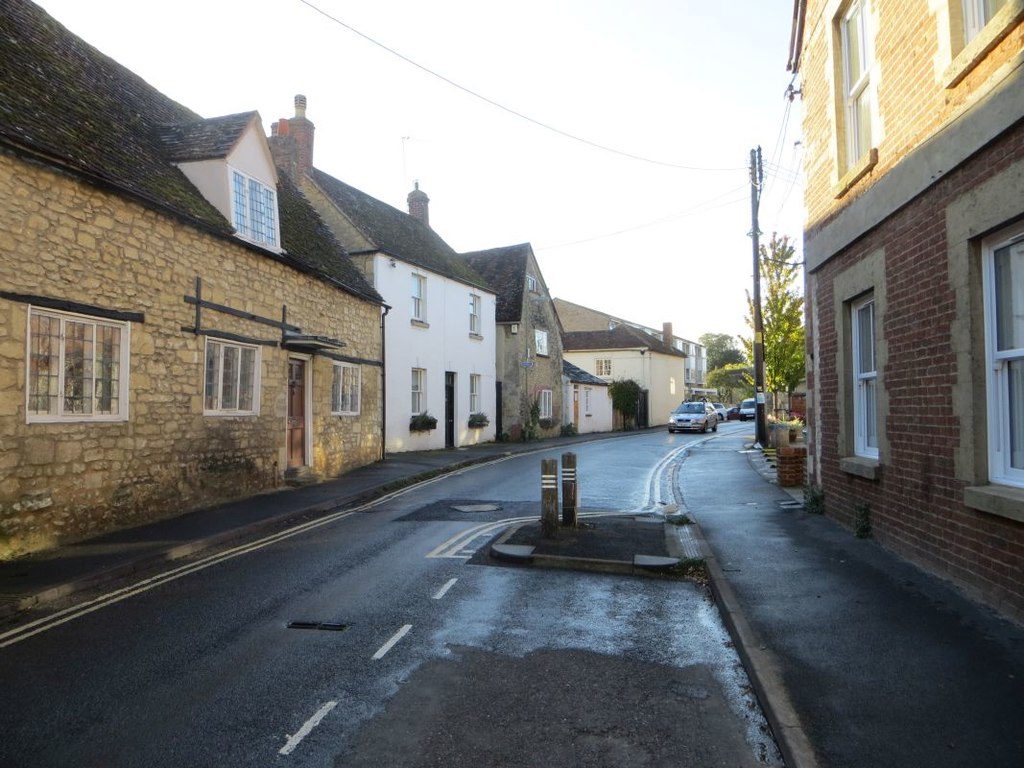
 Photo: Bill Nicholls · CC BY-SA 2.0
Parks and walks in Wheatley
Parks and playing fields in Wheatley add up to 0.2 ha for every 1,000 residents; the typical UK town has 2.1. A park or playing field is within a 5-minute walk for 34% of residents. 38 km of footpaths run through the town and the kilometre around it, 2.4 for every square kilometre. Wheatley grades D− for the outdoors. A character grade: it isn’t part of the overall grade.
Wheatley grades D− for the outdoors
Each chart is every UK town of 1,000 or more on one measure: the green bar is Wheatley, the dashed line the typical town. The number is the share of towns it beats; the five are averaged and the average ranked again.
100
100
100
100
100
Graded, never part of the overall grade (like History and Civic life). It measures what is mapped: OS Open Greenspace leaves out woodland and open-access land that isn’t a park, and OpenStreetMap’s rural paths are more complete in some places than others.
How Wheatley compares with UK towns of 4,100 to 4,500
The 60 UK towns and cities of 4,100 to 4,500 people with an Outdoors Grade. Hover a dot for its figures; tap one for its page.
Wheatley falls furthest behind on park space per resident, where 59 of the 59 others do better.
Show as a table
| Town | Outdoors | Green space | Near a park | Path per km² | Protected | |
|---|---|---|---|---|---|---|
| 1 | West Malling Kent | A+ | 8.7 | 100% | 3.4 | 21% |
| 2 | Telscombe Cliffs East Sussex | A+ | 3 | 58% | 5.1 | 42% |
| 3 | Great Denham Bedfordshire | A | 14.7 | 100% | 5.3 | 0% |
| 4 | Aberbargoed Gwent | A | 22.8 | 95% | 5.6 | 0% |
| 5 | Denaby Main South Yorkshire | A | 10.4 | 100% | 3.8 | 0% |
| 6 | Overton Hampshire | A | 3.7 | 92% | 2.5 | 45% |
| 7 | Whittle-le-Woods Lancashire | A− | 7.7 | 91% | 4 | 0% |
| 8 | Loftus North Yorkshire | A− | 1.9 | 90% | 2 | 31% |
| 9 | Exminster Devon | A− | 2.5 | 100% | 2.7 | 0% |
| 10 | Arborfield Garrison Berkshire | A− | 10.4 | 95% | 3.3 | 0% |
| 11 | Stokenchurch Buckinghamshire | A− | 2.3 | 90% | 2.6 | 86% |
| 12 | Hunstanton Norfolk | A− | 3.7 | 71% | 1.4 | 31% |
| 13 | Fairford Gloucestershire | A− | 3.4 | 100% | 1.8 | 17% |
| 14 | Horsford Norfolk | B+ | 6.5 | 97% | 2.8 | 0% |
| 15 | Ratby Leicestershire | B+ | 1.7 | 100% | 4.8 | 0% |
| 16 | Bramley and Wonersh Surrey | B+ | 1.7 | 77% | 3.5 | 59% |
| 17 | Girton Cambridgeshire | B+ | 2.8 | 92% | 3.6 | 0% |
| 18 | Clayton West and Scissett West Yorkshire | B | 1.4 | 100% | 4.2 | 0% |
| 19 | Winchcombe Gloucestershire | B | 2.2 | 60% | 3 | 81% |
| 20 | Brampton Cumbria | B | 2 | 92% | 2.2 | 9% |
| 21 | Penrhyn Bay Clwyd | B− | 0.6 | 68% | 3.3 | 0% |
| 22 | Earby Lancashire | B− | 1.4 | 93% | 4.7 | 0% |
| 23 | Woodford Halse Northamptonshire | B− | 3.6 | 100% | 1.6 | 0% |
| 24 | Topsham Devon | B− | 1.9 | 76% | 2.9 | 0% |
| 25 | Wilton Wiltshire | B− | 1.4 | 94% | 1.6 | 45% |
| 26 | Tibshelf Derbyshire | B− | 1.4 | 94% | 3.8 | 0% |
| 27 | Ferndale Mid Glamorgan | B− | 3.6 | 88% | 2.1 | 0% |
| 28 | Woburn Sands Buckinghamshire | C+ | 1.1 | 94% | 4.1 | 0% |
| 29 | Milford on Sea Hampshire | C+ | 1.2 | 50% | 2.1 | 21% |
| 30 | Kessingland Suffolk | C+ | 0.9 | 70% | 1.9 | 19% |
| 31 | Old Tupton Derbyshire | C+ | 2.3 | 73% | 3.9 | 0% |
| 32 | Eaton Bray and Edlesborough Bedfordshire | C+ | 2.6 | 72% | 1.7 | 29% |
| 33 | Backwell Somerset | C+ | 2.3 | 57% | 4.4 | 0% |
| 34 | Sandwich Kent | C+ | 2.1 | 51% | 2.5 | 0% |
| 35 | Sible Hedingham Essex | C+ | 0.9 | 100% | 2.9 | 0% |
| 36 | Knebworth Hertfordshire | C+ | 1.5 | 81% | 3.8 | 0% |
| 37 | Halfway Houses Kent | C | 1.8 | 71% | 1.8 | 0% |
| 38 | Hope Clwyd | C | 8.5 | 64% | 2 | 0% |
| 39 | Brundall Norfolk | C | 1.6 | 62% | 2.3 | 20% |
| 40 | Meopham Kent | C | 1.3 | 53% | 2.5 | 35% |
| 41 | Uppingham Rutland | C | 2.2 | 89% | 1.6 | 0% |
| 42 | Branston Lincolnshire | C | 2.1 | 86% | 1.8 | 0% |
| 43 | Long Lawford Warwickshire | C | 1.2 | 91% | 2.6 | 0% |
| 44 | Llangennech Dyfed | C | 1.6 | 82% | 1.1 | 0% |
| 45 | Nelson Gwent | C | 2.1 | 88% | 1.5 | 0% |
| 46 | Cuffley Hertfordshire | C− | 13.6 | 19% | 1.9 | 0% |
| 47 | Ellesmere Shropshire | C− | 12.5 | 54% | 1.3 | 0% |
| 48 | Chudleigh Devon | C− | 0.3 | 83% | 1.4 | 15% |
| 49 | Epworth Lincolnshire | C− | 1.6 | 75% | 2.2 | 0% |
| 50 | Doddington and Wimblington Cambridgeshire | C− | 2.5 | 73% | 1.2 | 0% |
| 51 | Great Ayton North Yorkshire | C− | 0.2 | 48% | 2.2 | 31% |
| 52 | West Kingsdown Kent | D | 0.8 | 28% | 1.6 | 52% |
| 53 | North Weald Bassett Essex | D | 1.4 | 67% | 2.4 | 0% |
| 54 | Shepperton Green Surrey | D | 1.4 | 73% | 1.7 | 0% |
| 55 | Blidworth Nottinghamshire | D | 0.5 | 23% | 3.2 | 0% |
| 56 | Kegworth Leicestershire | D | 0.4 | 54% | 2.6 | 0% |
| 57 | Llantrisant Mid Glamorgan | D− | 0.6 | 42% | 2.3 | 0% |
| 58 | Wheatley Oxfordshire | D− | 0.2 | 34% | 2.4 | 0% |
| 59 | Warboys Cambridgeshire | D− | 0.4 | 67% | 1 | 0% |
| 60 | Pinchbeck Lincolnshire | D− | 1 | 49% | 1 | 0% |
Parks, footpaths & countryside
Tap a number to zoom to a park. Tap a layer to hide it. The dashed line is Wheatley’s built-up area.
3 in 10 Wheatley residents live within a 5-minute walk of a park
Each square is 1 in 100 residents: green lives within 400 m of a public park, garden or playing field (Census 2021 output areas against OS Open Greenspace).
About 2,800 people live further than that. Playing fields count, so a park within reach isn’t always one with paths or trees; 5 playgrounds are mapped in and around the town, about one for every 861 residents.
The North Wessex Downs National Landscape is 6.5 mi away
Protected landscapes within 30 km, by direction and distance from the edge of the built-up area; circle size shows each one’s area. National Landscapes were called Areas of Outstanding Natural Beauty until 2023.
6 waymarked walks pass through or near Wheatley
38 km of footpaths, bridleways and rights of way are mapped in Wheatley and the kilometre around it, 2.4 km for every square kilometre (the typical UK town has 3.0). Bars show each route’s kilometres within 2 km of the town.
Close to home, the Boundary Patrol has 5 km of local walk within 2 km of the town. 3 regional routes pass through, including the Oxford Green Belt Way, Oxfordshire Way and The Roman Way.
Waymarked walks are OpenStreetMap walking routes. Public rights of way are only as complete as the map in each area.
The best walking months in Wheatley: May to September
The town’s 1991–2020 averages (Met Office HadUK-Grid) and the daylight at its latitude. Outlined months have 12½+ hours of daylight, highs of 15 °C or more and little rain for the town.
| Jan | Feb | Mar | Apr | May | Jun | Jul | Aug | Sep | Oct | Nov | Dec | |
|---|---|---|---|---|---|---|---|---|---|---|---|---|
| Daylight (h) | 8.3 | 9.9 | 11.7 | 13.8 | 15.6 | 16.7 | 16.2 | 14.6 | 12.6 | 10.5 | 8.7 | 7.8 |
| High (°C) | 8 | 8 | 11 | 14 | 17 | 20 | 23 | 22 | 19 | 15 | 11 | 8 |
| Rain (mm) | 60 | 47 | 48 | 48 | 57 | 55 | 54 | 65 | 55 | 75 | 76 | 67 |
February is the driest month (47 mm) and July the warmest (highs of 23 °C). Winter days are short, about 8 hours of daylight in December, and 76 mm of rain falls in November, the wettest month. Frost comes on about 45 nights a year. The climate in Wheatley →
5 playgrounds and the nearest beaches
Mapped within 2 km of the town in OpenStreetMap, against the typical UK town its size per resident. Named places are listed with directions; unnamed ones are only counted.
The nearest beaches
Wheatley is inland. These are the nearest named beaches, measured from the edge of the town.
Check the water before you swim. The Environment Agency tests designated bathing waters from May to September and publishes a rating for each beach.
Every named place, with directions
Viewpoints 1
Hills and peaks 4
Nature reserves 2
Picnic sites 1
Playgrounds 5
Plus 5 playgrounds without a name on the map.
Campsites 1
The outdoors in nearby towns
The nearest towns of 1,000+ within 12 miles. Tap a town for its outdoors page.
| Town | Outdoors | Green space, ha per 1,000 | Near a park | Protected within 5 km |
|---|---|---|---|---|
| Wheatley | D− | 0.2 | 34% | 0% |
| Horspath 1.5 mi | B | 14.0 | 54% | 0% |
| Garsington 2.3 mi | D | 0.4 | 65% | 0% |
| Oxford 4.1 mi | B+ | 2.4 | 90% | 0% |
| Oakley 4.6 mi | B | 2.9 | 100% | 0% |
| Kennington 5.1 mi | C+ | 2.1 | 58% | 0% |
| Berinsfield 6.0 mi | D | 0.1 | 0% | 11% |
Oxford, 4.1 miles away, grades B+, the best next door: 90% of its residents live within 400 m of a park. Horspath, Garsington and Oxford have at least twice Wheatley’s green space per resident.
Questions about the outdoors in Wheatley
Is Wheatley near a National Park?
The nearest protected landscape is the North Wessex Downs National Landscape, 6.5 mi south of the town’s edge. It covers 1,731 km² and was designated in 1972.
What are the best walks near Wheatley?
6 waymarked walking routes pass within 2 km of the town, including the Oxford Green Belt Way, Oxfordshire Way and Boundary Patrol.
What is the nearest beach to Wheatley?
The Leys Park, 14 mi from the edge of the town, then The Beach (31 mi). Wheatley itself is inland.
How many people in Wheatley live near a park?
34% of residents live within 400 m, about a 5-minute walk, of a public park, garden or playing field (Census 2021 output areas against OS Open Greenspace). The typical UK town is 83%.
When is the best time of year for walking in Wheatley?
May to September: the longest days, the warmest afternoons and the least rain of the year, from the Met Office 1991–2020 averages.
Is Wheatley good for walking?
About average for paths: 2.4 km of footpath and right of way per square kilometre, more than 41% of UK towns. For park space per person it beats 2% (0.2 ha per 1,000 residents).
How is the Outdoors Grade worked out?
From five measures, each placed among UK towns of 1,000 or more: public green space per resident, the share living near a park, National Park or National Landscape within 5 km, footpaths per square kilometre, and the sea within 5 km. It is a character grade and isn’t part of Wheatley’s overall grade.
Where Wheatley’s outdoors figures come from
- Parks and green space: Ordnance Survey OS Open Greenspace (parks and gardens, playing fields, play spaces, and their access points). Contains OS data © Crown copyright and database right 2026, Open Government Licence v3.0.
- National Parks and National Landscapes: Natural England and Natural Resources Wales boundaries, areas and designation dates, Open Government Licence v3.0.
- Footpaths, walking routes, beaches and things to do: © OpenStreetMap contributors, Open Database License (ODbL), via Geofabrik, 16 October 2026.
- Historic parks, listed buildings and monuments: Historic England, National Heritage List for England, Open Government Licence v3.0.
- Rain and temperature: Met Office HadUK-Grid 1991–2020 averages for the town; daylight calculated from its latitude.
- The sea: ONS Countries (December 2024) boundaries clipped to mean high water. Residents near a park: ONS Census 2021 output areas.
- Grade: TownRatings’ Outdoors Grade, ranked against UK towns only.
Contains public sector information licensed under the Open Government Licence v3.0. Contains HM Land Registry data © Crown copyright and database right 2026. Contains OS data © Crown copyright and database right 2026 (ONS boundaries). Northern Ireland: Source: NISRA; contains Land & Property Services data and Ordnance Survey of Northern Ireland information, © Crown copyright, licensed under the Open Government Licence v3.0. Scotland: contains National Records of Scotland data, Registers of Scotland data and SEPA data, © Crown copyright / © SEPA 2025, licensed under the Open Government Licence v3.0.