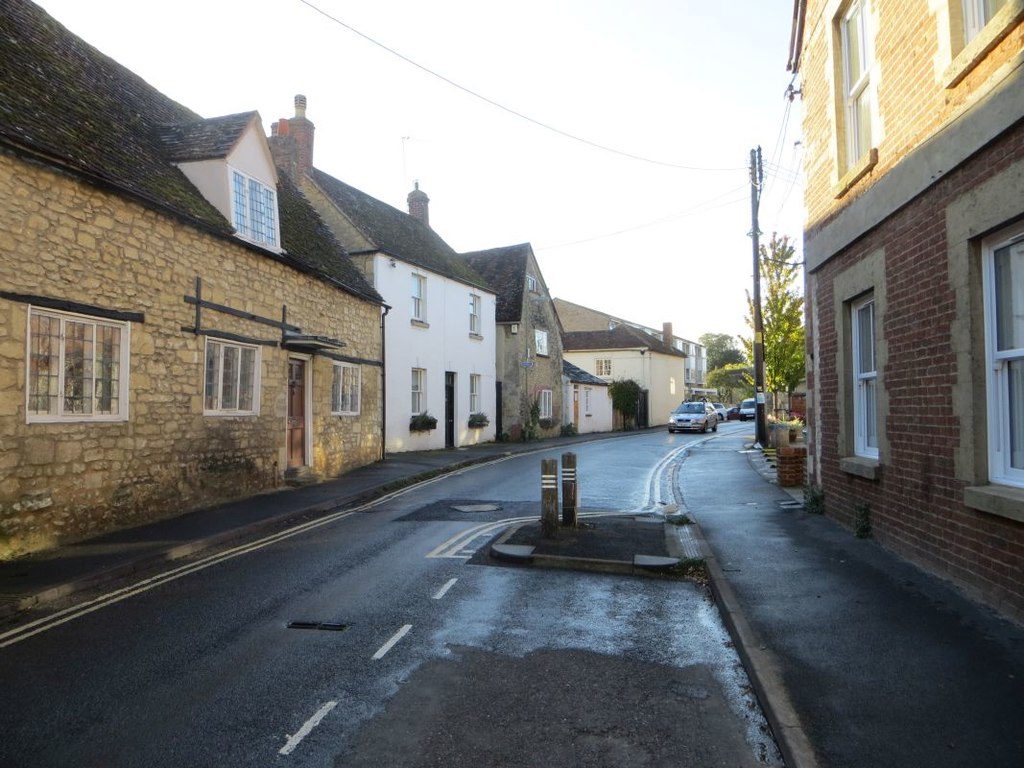
 Photo: Bill Nicholls · CC BY-SA 2.0
Wheatley stands out for shoplifting: 5.3 times the rate of a typical town its size
Violence recorded locally dropped 30% in a year. Recorded violent and sexual offences ran at 20.3 per 1,000 residents a year, and burglary, vehicle crime and damage at 9.6. Taking everything together, Wheatley scores B (#21 of 38 in Oxfordshire): close to the middle of UK towns, measured on crimes police recorded inside its built-up area between September 2023 and August 2026. For its size, it sits below 59% of the 1,308 UK towns of 2,500 to 10,000 people on crime per resident.
Crimes and reports per 1,000 residents (Census 2021) a year, September 2023 to August 2026.
What stands out about safety in Wheatley
Violent crime fell over the year
In the 12 months to August 2026 police recorded 30% less violent crime per resident in Wheatley than in the year before; across UK towns of 2,500 to 10,000 people violent crime held steady. Trend ↓
About the middle for a town its size
Of 706 UK towns of 3,000 to 6,000 people, Wheatley has the 300th lowest rate of graded crime: lower than Lanchester, Fulbourn and Kingsbury, higher than Lambourn, Ripponden and Needham Market. Towns its size ↓
Many neighbourhoods rank low for crime nationally
The government’s Indices of Deprivation 2025 rank every neighbourhood in England on recorded crime. 53% of Wheatley’s residents live in one of the lowest-crime 10%, and 0% in one of the highest-crime 20%. Neighbourhood ranks ↓
Written from the police.uk and government data on this page. Figures are crimes police recorded, not convictions.
The B for Wheatley, and how it is built
A fairly firm grade. Built on 386 graded crimes over three years. The grade adds violent and sexual offences and crimes against homes and vehicles per resident and ranks Wheatley against every UK town of 1,000 or more.
Per resident, against all UK towns; beside it, how it compares with towns its size.
How crime in Wheatley has moved
“Towns its size” pools all UK towns of 2,500 to 10,000 people that police.uk covers each month (Greater Manchester has no data).
Rolling twelve-month rate, per 1,000 residents a year (longer windows for smaller places, where a few crimes swing a month). In the 12 months to August 2026 against the 12 before: violent -30% (towns its size +1%), homes and vehicles +15% (towns its size -1%), shoplifting and theft +57% (towns its size +2%), anti-social behaviour +4% (towns its size +0%).
What police recorded in the last 12 months
Against the typical town its size, Wheatley runs highest on shoplifting (9.8 per 1,000 against 1.8), other theft (5.3 per 1,000 against 3.2) and burglary (2.8 per 1,000 against 1.9). Anti-social behaviour and violence & sexual offences sit below it.
Show as a table
| Category | In the grade | Reports | Per 1,000 | Typical |
|---|---|---|---|---|
| Violence & sexual offences | Violent | 65 | 15.1 | 22.4 |
| Shoplifting | not graded | 42 | 9.8 | 1.8 |
| Anti-social behaviour | not graded | 28 | 6.5 | 8.8 |
| Other theft | not graded | 23 | 5.3 | 3.2 |
| Criminal damage & arson | Home & vehicle | 22 | 5.1 | 4.5 |
| Public order | not graded | 14 | 3.3 | 3.6 |
| Burglary | Home & vehicle | 12 | 2.8 | 1.9 |
| Vehicle crime | Home & vehicle | 11 | 2.6 | 2 |
| Drugs | not graded | 7 | 1.6 | 1 |
| Robbery | Violent | 6 | 1.4 | 0.2 |
| Other crime | not graded | 4 | 0.9 | 1.5 |
| Possession of weapons | Violent | 2 | 0.5 | 0.4 |
| Theft from the person | not graded | 1 | 0.2 | 0 |
| Bicycle theft | not graded | 0 | 0 | 0.1 |
“Violent” is police.uk’s violence and sexual offences (which includes harassment, stalking and assault without injury), robbery and possession of weapons. Anti-social behaviour isn’t a crime category; shoplifting and other theft happen mostly in shops and town centres rather than to residents, so neither counts in the grade.
September 2025 to August 2026, per 1,000 residents. The tick on each bar is the typical (median) town among UK towns of 2,500 to 10,000 people.
Most Wheatley residents live in one of England’s lowest-crime neighbourhoods
53% of residents live in the lowest-crime 30% of England’s neighbourhoods, and 0% in the highest-crime 20%. The crime domain scores the risk of violence, burglary, theft and criminal damage where people live, so it can read differently from the town-wide rate, which counts crimes where they happened.
Wheatley’s residents by the crime decile of their neighbourhood (LSOA, about 1,500 people) in the English Indices of Deprivation 2025 (crime domain), where 1 is the highest-crime 10% of England’s neighbourhoods and 10 the lowest.
Police in Wheatley identify a suspect more often than across UK towns
No suspect was identified for 58% of Wheatley’s burglaries, vehicle crimes and criminal damage, against 69% across UK towns, and for 8% of violent and sexual offences against 19%. Most violent cases close as “unable to prosecute” (48% here), usually because the victim doesn’t support a prosecution. About 21% of violent and 8% of household crimes reached court.
The latest outcome police.uk shows for each crime recorded in the first of the three years (September 2023 to August 2024), so most cases have closed. 124 crimes.
300th of 706: Wheatley among towns its size
| # | Town | People | Violent | Homes & vehicles | Shops & theft | Safety |
|---|---|---|---|---|---|---|
| 1 | Bailrigg Lancashire | 4,788 | 4.7 | 2.5 | 7.9 | A+ |
| … | ||||||
| 26 | Goring Oxfordshire | 3,434 | 8.6 | 6.4 | 4 | A |
| … | ||||||
| 30 | Adderbury and Twyford Oxfordshire | 3,318 | 12.5 | 3.1 | 3.3 | A |
| … | ||||||
| 62 | Long Hanborough Oxfordshire | 3,034 | 14.1 | 4.4 | 5.1 | A |
| … | ||||||
| 64 | Kennington Oxfordshire | 4,595 | 12.7 | 6 | 7.5 | A |
| … | ||||||
| 297 | Lambourn Berkshire | 3,141 | 22 | 7.9 | 3.8 | B |
| 298 | Ripponden West Yorkshire | 4,775 | 20.3 | 9.6 | 4.5 | B |
| 299 | Needham Market Suffolk | 5,055 | 20.6 | 9.3 | 7.1 | B |
| 300 | Wheatley Oxfordshire | 4,305 | 20.3 | 9.6 | 10.9 | B |
| 301 | Kirkburton West Yorkshire | 4,033 | 20.6 | 9.3 | 5 | B |
| 302 | Kessingland Suffolk | 4,242 | 20.5 | 9.4 | 5.7 | B |
| 303 | Dunton Green Kent | 3,241 | 18.2 | 11.8 | 2.7 | B |
| … | ||||||
| 706 | Eastchurch Kent | 3,381 | 132 | 13.9 | 3.5 | D− |
Safety letters rank against every UK town of 1,000 or more; the order here is context only.
Graded crime per 1,000 residents a year, September 2023 to August 2026, counting from the least: towns ranked near Wheatley, and others in Oxfordshire.
Crime in Wheatley per 1,000 residents
A crime isn’t a victim: one person can report several, and crimes in a town centre often involve visitors rather than residents.
And about 10 burglaries, vehicle crimes or acts of criminal damage, plus 15 shoplifting and theft reports, in the 12 months to August 2026. Each dot is one resident; each coloured dot is one recorded crime.
No one died in a collision on Wheatley’s roads in 2021–2025
Police recorded 19 collisions with injuries inside Wheatley in five years. 2 people were killed or seriously injured: 0 on foot and 1 on a bicycle.
Most UK towns of 2,500 to 10,000 people (81%) had no road deaths in these five years, and Wheatley is one of them.
Counting serious injuries too, a town of Wheatley’s size at the median for UK towns of 2,500 to 10,000 people would see about 4 people killed or seriously injured in five years; Wheatley had 2.
Casualties are counted where the collision happened, not where people lived: a main road through town adds through-traffic, and residents’ own risk on roads elsewhere isn’t here. Seriously injured uses the Department for Transport’s adjusted figures, which even out the police forces’ different ways of recording injuries. There’s no national rate here: more than half of road deaths in England and Wales (58%) happen outside every town’s built-up area. Source: DfT road casualty statistics (STATS19), 2021–2025.
Collisions police recorded inside Wheatley’s built-up area, 2021–2025. Described here; not part of the Safety Grade.
Crime in the places around Wheatley
| Town | People | Violent | Homes & vehicles | Safety |
|---|---|---|---|---|
| Wheatley | 4,305 | 20.3 | 9.6 | B |
| Horspath | 1,467 | 16.6 | 3.9 | A− |
| Garsington | 1,295 | 13.9 | 8.5 | A− |
| Oxford | 170,799 | 37 | 15.1 | C− |
| Oakley | 1,129 | 9.7 | 2.7 | A+ |
| Kennington | 4,595 | 12.7 | 6 | A |
| Berinsfield | 2,773 | 32.1 | 7.9 | C+ |
| Chalgrove | 2,807 | 21.1 | 3.6 | B+ |
Wheatley records more graded crime per resident than 5 of its 7 neighbours; only Oxford and Berinsfield record more. Horspath, 1.5 miles away, records 16.6 violent and sexual offences per 1,000 residents a year (3-year average), against Wheatley’s 20.3.
Per 1,000 residents a year, the same three years. Tap a town for its safety page.
What this data can and can’t tell you
- Where crimes happen, not where victims live. police.uk places each crime at a point near where it happened. Town centres with shops, stations, a hospital and nightlife record more crime per resident, and residents of nearby villages who come in to shop or go out are part of that count.
- Bigger towns record more per resident. Across UK towns, recorded crime per resident rises steeply with size, more than in the U.S., so a city’s grade sits low against the whole UK. The “towns its size” figures show where Wheatley sits among towns like it; they are context and don’t change the grade.
- Points are approximate. police.uk moves each point to the nearest of a set of anonymous map points, so crimes near the edge of the built-up area can fall either side of it.
Questions about safety in Wheatley
Is Wheatley safe?
Police recorded 20.3 violent and sexual offences and 9.6 burglaries, vehicle crimes and acts of criminal damage per 1,000 residents a year over the three years to August 2026 (police.uk, inside Wheatley’s built-up area). That earns a B for safety: less crime per resident than 56% of UK towns. Among 706 UK towns of 3,000 to 6,000 people, Wheatley is 300th from the least crime. 53% of residents live in neighbourhoods in England’s lowest-crime 10%.
Is crime going up in Wheatley?
In the 12 months to August 2026, against the 12 months before, violent crime fell 30%, burglary, vehicle crime and damage rose 15%, shoplifting and theft rose 57% and anti-social behaviour held steady. Across UK towns of 2,500 to 10,000 people, violent crime held steady.
What is the most common crime in Wheatley?
Violence & sexual offences: 65 in the 12 months to August 2026, which in police.uk includes harassment, stalking and assault without injury. Next came shoplifting (42) and other theft (23), with 28 reports of anti-social behaviour.
How does Wheatley compare with Oxford?
Oxford records 37 violent and sexual offences and 15.1 crimes against homes and vehicles per 1,000 residents a year, against Wheatley’s 20.3 and 9.6, over the same three years.
Sources: data.police.uk street-level crime, 36 months to August 2026, points inside the built-up-area boundary · ONS Census 2021, output areas summed to the ONS 2022 built-up area · MHCLG English Indices of Deprivation 2025, crime domain by LSOA (residents from ONS Census 2021) · Department for Transport road casualty statistics (STATS19), collisions 2021–2025, points inside the built-up-area boundary · TownRatings grades: our own summary of the data, ranked against UK towns only. All under the Open Government Licence v3.0.
Contains public sector information licensed under the Open Government Licence v3.0. Contains HM Land Registry data © Crown copyright and database right 2026. Contains OS data © Crown copyright and database right 2026 (ONS boundaries). Northern Ireland: Source: NISRA; contains Land & Property Services data and Ordnance Survey of Northern Ireland information, © Crown copyright, licensed under the Open Government Licence v3.0. Scotland: contains National Records of Scotland data, Registers of Scotland data and SEPA data, © Crown copyright / © SEPA 2025, licensed under the Open Government Licence v3.0.