Girton’s biggest
Sensory Garden
Park or garden
0.1 ha (0 acres)0.1 km of path
Centralin the middle of Girton
Directionsto the nearest entrance
Each edition grades its towns against each other only.
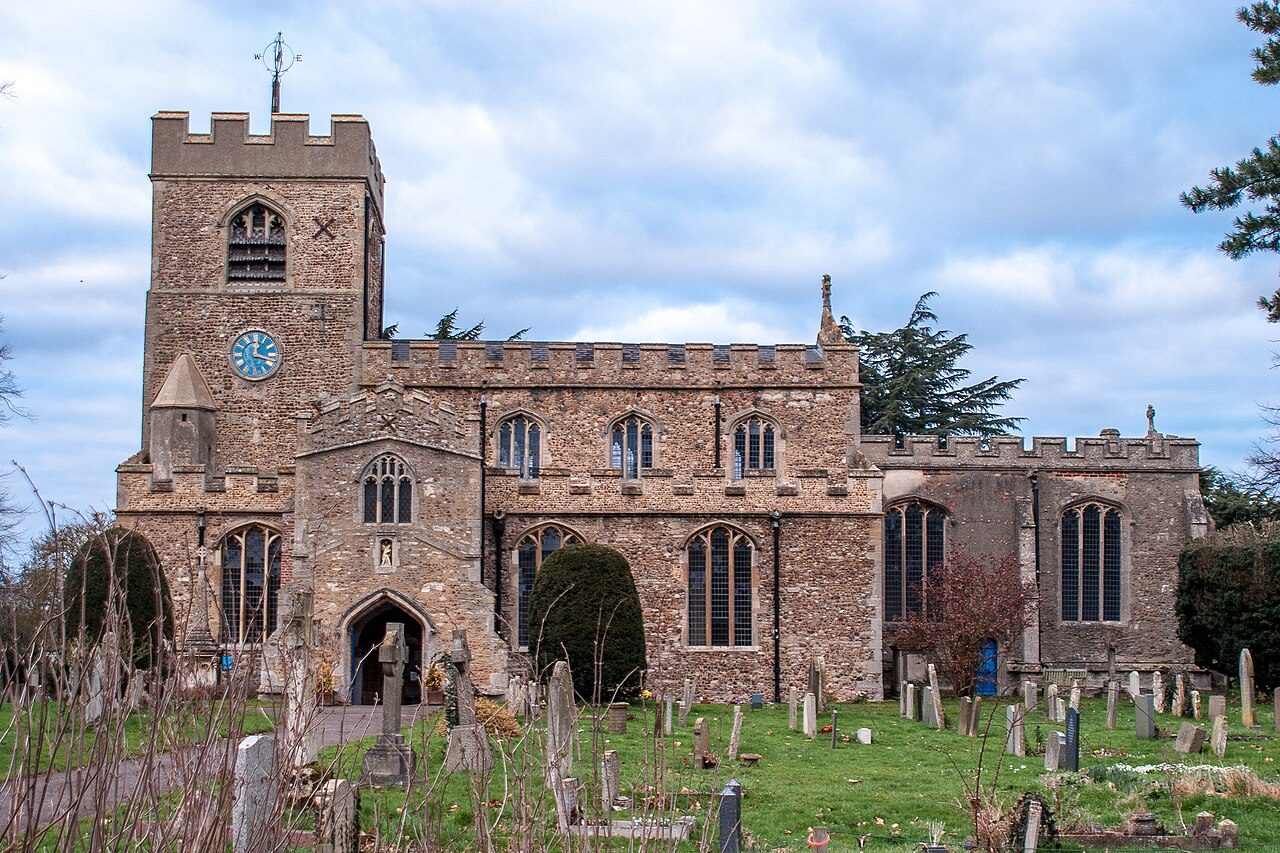 Photo: Ben Wilkinson · CC BY 3.0
Footpaths add up to 44 km in the town and the kilometre around it, 3.6 for every square kilometre. Parks and playing fields in Girton add up to 2.8 ha for every 1,000 residents; the typical UK town has 2.1. Girton grades B+ for the outdoors: #7 of 50 in Cambridgeshire. A character grade: it isn’t part of the overall grade.
Each chart is every UK town of 1,000 or more on one measure: the green bar is Girton, the dashed line the typical town. The number is the share of towns it beats; the five are averaged and the average ranked again.
Graded, never part of the overall grade (like History and Civic life). It measures what is mapped: OS Open Greenspace leaves out woodland and open-access land that isn’t a park, and OpenStreetMap’s rural paths are more complete in some places than others.
The 60 UK towns and cities of 4,200 to 4,600 people with an Outdoors Grade. Hover a dot for its figures; tap one for its page.
Against towns its size, Girton stands out most for park space per resident: only 15 of the other 59 have more.
| Town | Outdoors | Green space | Near a park | Path per km² | Protected | |
|---|---|---|---|---|---|---|
| 1 | Keswick Cumbria | A+ | 9.1 | 100% | 4.1 | 100% |
| 2 | Lawford Essex | A+ | 3.4 | 94% | 2.8 | 40% |
| 3 | Great Denham Bedfordshire | A | 14.7 | 100% | 5.3 | 0% |
| 4 | Aberbargoed Gwent | A | 22.8 | 95% | 5.6 | 0% |
| 5 | Denaby Main South Yorkshire | A | 10.4 | 100% | 3.8 | 0% |
| 6 | Overton Hampshire | A | 3.7 | 92% | 2.5 | 45% |
| 7 | Kimberley Nottinghamshire | A− | 2.9 | 100% | 4.8 | 0% |
| 8 | Whittle-le-Woods Lancashire | A− | 7.7 | 91% | 4 | 0% |
| 9 | Loftus North Yorkshire | A− | 1.9 | 90% | 2 | 31% |
| 10 | Exminster Devon | A− | 2.5 | 100% | 2.7 | 0% |
| 11 | Arborfield Garrison Berkshire | A− | 10.4 | 95% | 3.3 | 0% |
| 12 | Stokenchurch Buckinghamshire | A− | 2.3 | 90% | 2.6 | 86% |
| 13 | Horsford Norfolk | B+ | 6.5 | 97% | 2.8 | 0% |
| 14 | Girton Cambridgeshire | B+ | 2.8 | 92% | 3.6 | 0% |
| 15 | Elmswell Suffolk | B | 2.5 | 100% | 2.9 | 0% |
| 16 | Clayton West and Scissett West Yorkshire | B | 1.4 | 100% | 4.2 | 0% |
| 17 | Winchcombe Gloucestershire | B | 2.2 | 60% | 3 | 81% |
| 18 | Sowerby Bridge West Yorkshire | B | 4.5 | 72% | 3.9 | 0% |
| 19 | Earby Lancashire | B− | 1.4 | 93% | 4.7 | 0% |
| 20 | Woodford Halse Northamptonshire | B− | 3.6 | 100% | 1.6 | 0% |
| 21 | Alderley Edge Cheshire | B− | 2.2 | 86% | 3.7 | 0% |
| 22 | Wilton Wiltshire | B− | 1.4 | 94% | 1.6 | 45% |
| 23 | Tibshelf Derbyshire | B− | 1.4 | 94% | 3.8 | 0% |
| 24 | Ferndale Mid Glamorgan | B− | 3.6 | 88% | 2.1 | 0% |
| 25 | Woburn Sands Buckinghamshire | C+ | 1.1 | 94% | 4.1 | 0% |
| 26 | Milford on Sea Hampshire | C+ | 1.2 | 50% | 2.1 | 21% |
| 27 | Stamford Bridge East Riding of Yorkshire | C+ | 2.5 | 100% | 1.4 | 0% |
| 28 | Backwell Somerset | C+ | 2.3 | 57% | 4.4 | 0% |
| 29 | Halfway Houses Kent | C | 1.8 | 71% | 1.8 | 0% |
| 30 | Queen's Hills Norfolk | C | 0.4 | 100% | 3 | 0% |
| 31 | Backworth Tyne and Wear | C | 2 | 59% | 4.4 | 0% |
| 32 | Hope Clwyd | C | 8.5 | 64% | 2 | 0% |
| 33 | Clapham Bedfordshire | C | 1.3 | 94% | 2.7 | 0% |
| 34 | Kilburn and Horsley Woodhouse Derbyshire | C | 1.6 | 75% | 3.6 | 0% |
| 35 | Skelmanthorpe West Yorkshire | C | 1 | 88% | 3.2 | 0% |
| 36 | Brundall Norfolk | C | 1.6 | 62% | 2.3 | 20% |
| 37 | Meopham Kent | C | 1.3 | 53% | 2.5 | 35% |
| 38 | Uppingham Rutland | C | 2.2 | 89% | 1.6 | 0% |
| 39 | Long Lawford Warwickshire | C | 1.2 | 91% | 2.6 | 0% |
| 40 | Branston Lincolnshire | C | 2.1 | 86% | 1.8 | 0% |
| 41 | Llangennech Dyfed | C | 1.6 | 82% | 1.1 | 0% |
| 42 | Cuffley Hertfordshire | C− | 13.6 | 19% | 1.9 | 0% |
| 43 | Wesham Lancashire | C− | 1.7 | 87% | 1.8 | 0% |
| 44 | Chudleigh Devon | C− | 0.3 | 83% | 1.4 | 15% |
| 45 | Saxilby Lincolnshire | C− | 1.3 | 100% | 0.7 | 0% |
| 46 | Epworth Lincolnshire | C− | 1.6 | 75% | 2.2 | 0% |
| 47 | Doddington and Wimblington Cambridgeshire | C− | 2.5 | 73% | 1.2 | 0% |
| 48 | Great Ayton North Yorkshire | C− | 0.2 | 48% | 2.2 | 31% |
| 49 | Freckleton Lancashire | D | 0.4 | 73% | 1.4 | 0% |
| 50 | West Kingsdown Kent | D | 0.8 | 28% | 1.6 | 52% |
| 51 | North Weald Bassett Essex | D | 1.4 | 67% | 2.4 | 0% |
| 52 | Linton Cambridgeshire | D | 1.1 | 67% | 2.6 | 0% |
| 53 | Shepperton Green Surrey | D | 1.4 | 73% | 1.7 | 0% |
| 54 | Banks Lancashire | D | 0.3 | 33% | 1.7 | 0% |
| 55 | Blidworth Nottinghamshire | D | 0.5 | 23% | 3.2 | 0% |
| 56 | Broughton Lincolnshire | D | 0.9 | 39% | 2.7 | 0% |
| 57 | Kegworth Leicestershire | D | 0.4 | 54% | 2.6 | 0% |
| 58 | Wheatley Oxfordshire | D− | 0.2 | 34% | 2.4 | 0% |
| 59 | Warboys Cambridgeshire | D− | 0.4 | 67% | 1 | 0% |
| 60 | Pinchbeck Lincolnshire | D− | 1 | 49% | 1 | 0% |
Tap a number to zoom to a park. Tap a layer to hide it. The dashed line is Girton’s built-up area.
The biggest is Sensory Garden, 0.1 ha (0 acres). Directions go to the park’s nearest public entrance where Ordnance Survey maps one.
Each square is 1 in 100 residents: green lives within 400 m of a public park, garden or playing field (Census 2021 output areas against OS Open Greenspace).
About 400 people live further than that. Playing fields count, so a park within reach isn’t always one with paths or trees; 39 playgrounds are mapped in and around the town, about one for every 112 residents.
44 km of footpaths, bridleways and rights of way are mapped in Girton and the kilometre around it, 3.6 km for every square kilometre (the typical UK town has 3.0). Bars show each route’s kilometres within 2 km of the town.
The regional route here is the Harcamlow Way.
Waymarked walks are OpenStreetMap walking routes. Public rights of way are only as complete as the map in each area.
The town’s 1991–2020 averages (Met Office HadUK-Grid) and the daylight at its latitude. Outlined months have 12½+ hours of daylight, highs of 15 °C or more and little rain for the town.
| Jan | Feb | Mar | Apr | May | Jun | Jul | Aug | Sep | Oct | Nov | Dec | |
|---|---|---|---|---|---|---|---|---|---|---|---|---|
| Daylight (h) | 8.2 | 9.8 | 11.7 | 13.8 | 15.7 | 16.7 | 16.3 | 14.7 | 12.6 | 10.5 | 8.7 | 7.7 |
| High (°C) | 8 | 9 | 11 | 15 | 18 | 21 | 23 | 23 | 20 | 15 | 11 | 8 |
| Rain (mm) | 50 | 36 | 35 | 38 | 45 | 51 | 46 | 58 | 48 | 57 | 55 | 51 |
March is the driest month (35 mm) and July the warmest (highs of 23 °C). Winter days are short, about 8 hours of daylight in December, and 58 mm of rain falls in August, the wettest month. Frost comes on about 41 nights a year. The climate in Girton →
Mapped within 2 km of the town in OpenStreetMap, against the typical UK town its size per resident. Named places are listed with directions; unnamed ones are only counted.
Plus 1 viewpoint without a name on the map.
Plus 1 nature reserve without a name on the map.
Plus 2 picnic sites without a name on the map.
Plus 31 playgrounds without a name on the map.
The nearest towns of 1,000+ within 12 miles. Tap a town for its outdoors page.
Milton, 3.2 miles away, grades A, the best next door: every resident lives within 400 m of a park. Milton has at least twice Girton’s green space per resident. None of the neighbours has a protected landscape within 5 km either.
Sensory Garden, 0.1 ha (0 acres). 1 named park, garden or playing field is in the town or within 400 m of it.
No National Park or National Landscape is within 30 km (about 19 miles) of Girton.
4 waymarked walking routes pass within 2 km of the town, including the Harcamlow Way, Wimpole Way and Greenwich Meridian Trail (Cambridge Loop).
92% of residents live within 400 m, about a 5-minute walk, of a public park, garden or playing field (Census 2021 output areas against OS Open Greenspace). The typical UK town is 83%.
May to September: the longest days, the warmest afternoons and the least rain of the year, from the Met Office 1991–2020 averages.
For paths, yes: 3.6 km of footpath and right of way per square kilometre, more than 73% of UK towns. For park space per person it beats 67% (2.8 ha per 1,000 residents).
From five measures, each placed among UK towns of 1,000 or more: public green space per resident, the share living near a park, National Park or National Landscape within 5 km, footpaths per square kilometre, and the sea within 5 km. It is a character grade and isn’t part of Girton’s overall grade.
Contains public sector information licensed under the Open Government Licence v3.0. Contains HM Land Registry data © Crown copyright and database right 2026. Contains OS data © Crown copyright and database right 2026 (ONS boundaries). Northern Ireland: Source: NISRA; contains Land & Property Services data and Ordnance Survey of Northern Ireland information, © Crown copyright, licensed under the Open Government Licence v3.0. Scotland: contains National Records of Scotland data, Registers of Scotland data and SEPA data, © Crown copyright / © SEPA 2025, licensed under the Open Government Licence v3.0.