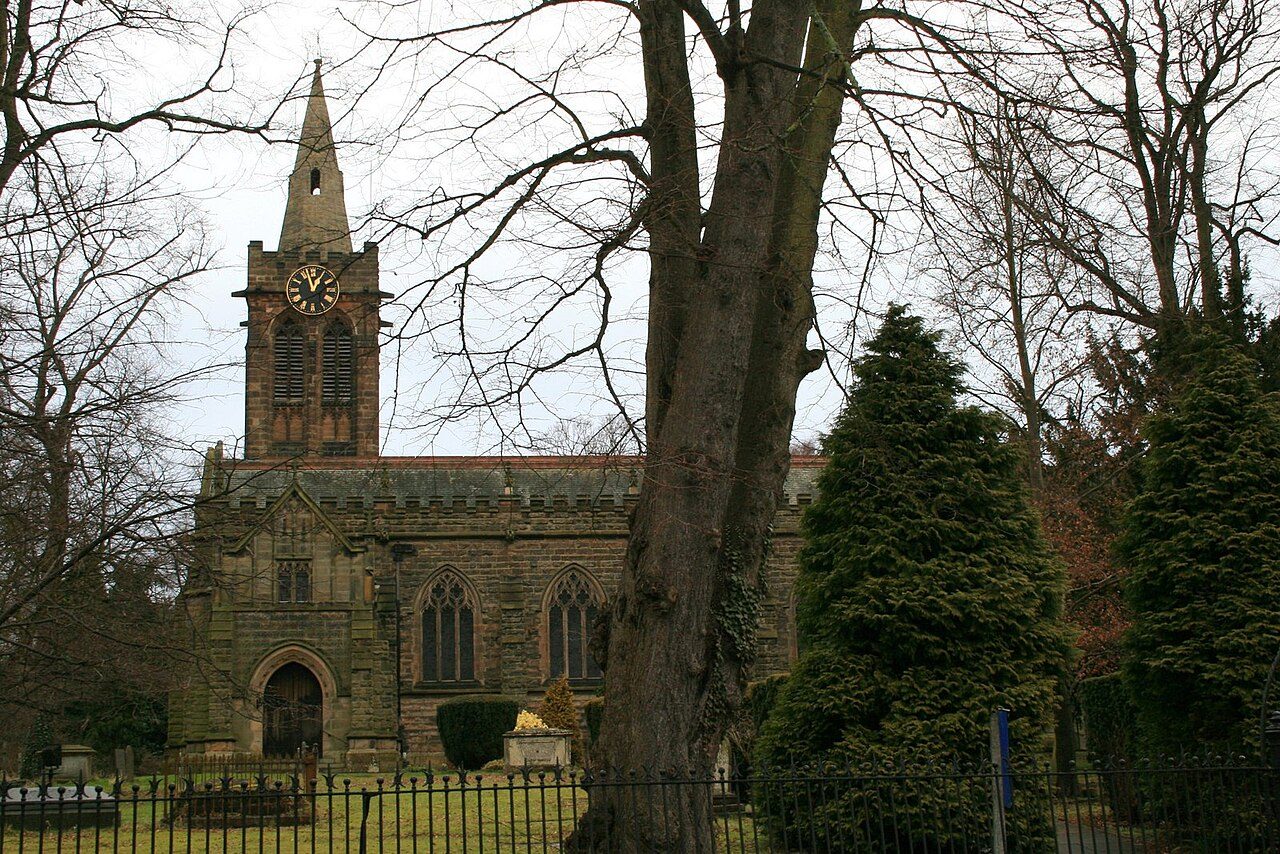
 Photo: David Lally · CC BY-SA 2.0
Heavy rain is Ruddington’s main flood risk: 7.6% of homes, against 0.2% from rivers or the sea
On the Environment Agency’s maps, which allow for flood defences, “high or medium” means at least a 1 in 100 chance of flooding from rivers or the sea in any year. Ruddington’s Hazard risk Grade is B−: #27 of 49 in Nottinghamshire.
What Ruddington faces
Each hazard against its own yardstick; meters run from low to high on that yardstick.
Rivers and the sea
Surface water
Flood warnings
Radon
Ruddington grades B− for hazard risk
Flood risk from rivers and the sea, against all UK towns.
The share of homes at high or medium risk from rivers and the sea, ranked against every UK town of 1,000 or more: fewer homes at risk is better. Towns with none at high or medium risk are ordered by their share at low risk, so they don’t all share one score. Surface water and radon aren’t graded: they are described below.
Where the water goes in Ruddington
Turn layers on and off. Blue is the risk from rivers and the sea; pink is where heavy rain collects. Both allow for flood defences.
The river and sea risk follows the River Trent, the River Greet and the Potwell Dyke. Surface-water risk is spread across the town, in dips, underpasses and along small streams, which is why more homes are exposed to it.
0.2% of Ruddington’s homes are at high or medium risk from rivers or the sea
The Environment Agency’s national map, allowing for defences. A further 2.9% are at low risk.
Share of each UK town’s homes at high or medium risk from rivers and the sea. 35% of UK towns have none; Ruddington has more than 49% of towns.
| # | Town | People | High or med. | |
|---|---|---|---|---|
| 1 | Kings Hill Kent | 9,963 | 0% | |
| 2 | Whitchurch Shropshire | 9,856 | 0% | |
| 3 | Queensbury West Yorkshire | 9,707 | 0% | |
| … | ||||
| 262 | Great Wakering Essex | 6,774 | 0.2% | |
| 263 | Annfield Plain County Durham | 7,786 | 0.2% | |
| 264 | Ruddington Nottinghamshire | 7,491 | 0.2% | |
| 265 | Olney Buckinghamshire | 6,600 | 0.2% | |
| 266 | Redbourn Hertfordshire | 5,188 | 0.2% | |
| … | ||||
| 537 | Sutton on Sea and Trusthorpe Lincolnshire | 5,042 | 42% | |
| 538 | Stainforth South Yorkshire | 5,999 | 63% | |
UK towns of 5,000 to 10,000 people.
The Environment Agency’s Risk of Flooding from Rivers and Sea (NaFRA2, June 2026) counts each postcode’s homes by band; the shares weight those postcodes by Census 2021 households. The EA counts include homes built since 2021.
Heavy rain puts about 38.1 times as many Ruddington homes at risk as rivers and the sea do
Surface water is rain that falls faster than drains and the ground can take it. It is mapped separately from rivers and the sea, and it is not in the Hazard risk Grade.
About 3.7% of homes are at high risk of surface-water flooding (a 1 in 30 chance or more each year) and 3.9% at medium risk: roughly 250 households. A further 13% face a low risk from surface water. That is more than 85% of UK towns.
Our estimate: every address in the town (ONS NSUL) read on the Environment Agency’s Risk of Flooding from Surface Water map (NaFRA2, 2025), each postcode’s share weighted by its Census 2021 households. Neither agency publishes a count of homes for surface water, so treat it as a guide; one street can differ from the next.
No flood warning or alert is in force for Ruddington · 0 warnings in 20 years
The Environment Agency has 0 flood warning areas and 1 alert area reaching into the town; warnings since the service began in 2006.
Show the 1 warning and alert areas
| Area | Kind | Since 2006 | Now |
|---|---|---|---|
| River Trent Tributaries in Nottinghamshire | Alert area | 140 | None |
Environment Agency Historic Flood Warnings (first issues only, not updates; “flood watch” counted as an alert before 2011) and the real-time flood-monitoring API. Sign up for free warnings on GOV.UK or call Floodline, 0345 988 1188.
Parts of Ruddington are in radon Affected Areas, at the low end
Radon is a natural radioactive gas from the ground; long exposure raises the risk of lung cancer. The atlas gives the chance that a home in each 1 km square is above the UK action level (200 Bq/m³).
100% of Ruddington’s built-up area is in a radon Affected Area (1% of homes or more above the action level).
The squares are indicative: each takes the highest band found anywhere inside it, so most homes in a coloured square are below it. Only a three-month test in the home gives a real answer.
BGS/UKHSA Indicative Atlas of Radon in Great Britain, version 3. Check an address at UKradon.org.
Flood risk in the places around Ruddington
Share of homes at high or medium and at low risk from rivers and the sea. Tap a town for its page.
Wilford, 2 miles north, has the most homes at risk around Ruddington (48% at high or medium). Edwalton, Gotham and Keyworth have none.
Get ready for what Ruddington faces
Free warnings, what to do in a cloudburst, and what to check before you move.
- Sign up free for Environment Agency flood warnings by text, call or email.
- Floodline: 0345 988 1188, 24 hours.
- Surface water rises in minutes, often with no warning issued: stay out of underpasses and dips.
- Keep the gullies and drains outside your home clear of leaves.
- Report a blocked road drain to the council.
- Test over three months, in a living room and a bedroom.
- Above 200 Bq/m³, a small sump and fan usually fixes it.
- New homes in radon areas are built with protection: basic from 3%, full from 10%.
- Check the address on GOV.UK’s long-term flood risk service: it gives rivers and sea and surface water separately.
- Ask whether the home has flooded or had a flood insurance claim; the TA6 property form asks the seller.
- Homes built before 2009 can get flood cover through Flood Re, the government-backed scheme; newer homes can’t.
- Check radon for the address on UKradon.org (a small fee) or ask the seller for a test result.
What this data can and can’t tell you
- Defences are counted. Both agencies’ maps allow for flood defences and the chance they are overtopped or fail, so a town behind a defence scheme can show few homes at high risk and many at low risk.
- Surface water is our estimate. Neither agency publishes a count of homes at risk from surface water, so we read each address on the map. A flat on a hill and a basement in a dip can share a postcode.
- One town, many streets. Risk is street by street. Check a specific address on GOV.UK’s long-term flood risk service before you buy or rent.
Questions about flooding and hazards in Ruddington
Does Ruddington flood?
0.2% of homes are at high or medium risk from rivers and the sea on the Environment Agency’s maps, which allow for flood defences. About 7.6% of homes are at high or medium risk from surface water, when heavy rain overwhelms the drains. Ruddington grades B− for hazard risk against UK towns.
Is Ruddington at risk of surface water flooding?
About 3.7% of homes are at high risk and 3.9% at medium risk from surface water, against 0.2% at high or medium risk from rivers and the sea. Surface water floods come with little warning, and the agencies don’t issue warnings for them.
Is radon a problem in Ruddington?
100% of the town’s built-up area is in a radon Affected Area on the BGS/UKHSA atlas. Most homes are below it; a three-month test is the only way to know.
Are there flood warnings in Ruddington now?
No flood warning or alert was in force near Ruddington at 13 November 2026, 20:18. Live warnings are on GOV.UK’s Check for flooding service and Floodline, 0345 988 1188.
Contains Environment Agency information © Environment Agency and/or database right 2026. Contains British Geological Survey materials © UKRI 2026.
Sources: Environment Agency Risk of Flooding from Rivers and Sea, postcodes in areas at risk (June 2026); Natural Resources Wales Flood Risk Assessment Wales (May 2026); ONS Census 2021 households by postcode · Environment Agency Risk of Flooding from Surface Water (NaFRA2, 2025) and Natural Resources Wales Flood Risk Assessment Wales surface water and small watercourses, read at every address (ONS National Statistics UPRN Lookup, September 2026) and weighted by Census 2021 households by postcode · Environment Agency real-time flood-monitoring API · Environment Agency Historic Flood Warnings (January 2006 to June 2026) and flood warning and alert areas · BGS/UKHSA Indicative Atlas of Radon in Great Britain, version 3, by 1 km square · TownRatings grades: our own summary of the data, ranked against UK towns only. All under the Open Government Licence v3.0.
Contains public sector information licensed under the Open Government Licence v3.0. Contains HM Land Registry data © Crown copyright and database right 2026. Contains OS data © Crown copyright and database right 2026 (ONS boundaries). Northern Ireland: Source: NISRA; contains Land & Property Services data and Ordnance Survey of Northern Ireland information, © Crown copyright, licensed under the Open Government Licence v3.0. Scotland: contains National Records of Scotland data, Registers of Scotland data and SEPA data, © Crown copyright / © SEPA 2025, licensed under the Open Government Licence v3.0.