Guest, Sign inJoin
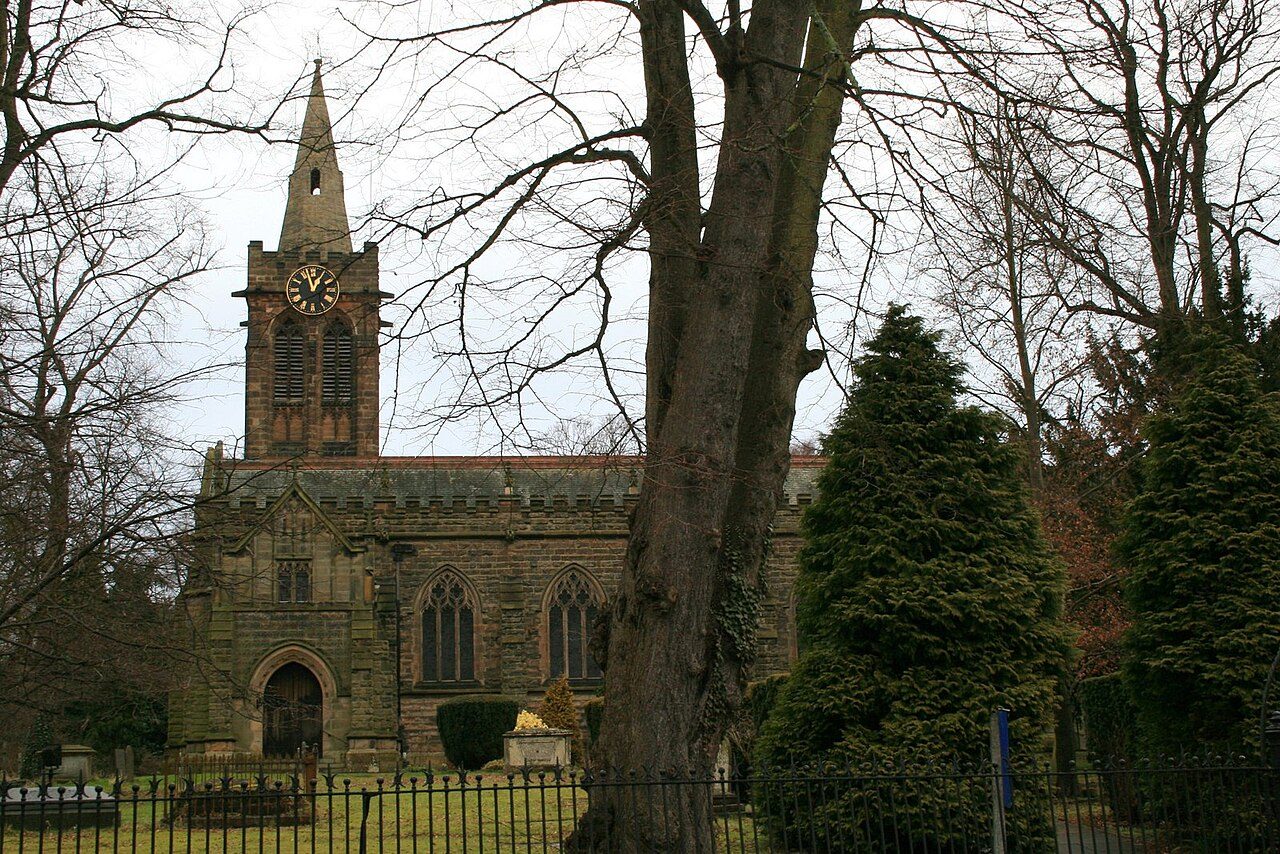
St Peter's, RuddingtonPhoto: David Lally · CC BY-SA 2.0
AOutdoors Grade
Outdoors in Ruddington · parks, paths & countryside

Almost everyone in Ruddington lives within a 5-minute walk of a park

Parks and playing fields in Ruddington add up to 9.7 ha for every 1,000 residents; the typical UK town has 2.1. 67 km of footpaths run through the town and the kilometre around it, 5.1 for every square kilometre. Ruddington grades A for the outdoors: #1 of 49 in Nottinghamshire. A character grade: it isn’t part of the overall grade.

Green space
9.7 ha
per 1,000 residents
Typical UK town 2.1
Near a park
100%
of residents within 400 m
Typical UK town 83%
Footpaths
67 km
5.1 km per km², town + 1 km
Typical UK town 3.0 per km²
Protected landscape
0%
of the land within 5 km
Character

What kind of outdoors town is Ruddington?

Read from the data: what stands out first, good and bad.

Ruddington’s strongest suit is parks close to every home, followed by plenty of park space.

Outdoors grade

Ruddington grades A for the outdoors

Each chart is every UK town of 1,000 or more on one measure: the green bar is Ruddington, the dashed line the typical town. The number is the share of towns it beats; the five are averaged and the average ranked again.

A
Better than 94% of UK towns#1 of 49 in Nottinghamshire · 4th of 60 UK towns its size
Public green space9.7 haper 1,000 residents: parks, gardens, playing fields, play spaces
typical 2.1 ha010+
96out of
100
A park within a walk100%of residents within 400 m (a 5-minute walk)
typical 83%0100+
89out of
100
National Park or National Landscape0%of the land within 5 km · None within 5 km
none100+
31out of
100
Footpaths5.1 kmper km², the town and 1 km around it
typical 3.0 km010+
93out of
100
The sea0%of the area within 5 km · Inland
none80+
42out of
100

Graded, never part of the overall grade (like History and Civic life). It measures what is mapped: OS Open Greenspace leaves out woodland and open-access land that isn’t a park, and OpenStreetMap’s rural paths are more complete in some places than others.

Towns its size

Ruddington is 4th of 60 UK towns its size for the outdoors

The 60 UK towns and cities of 7,200 to 7,800 people with an Outdoors Grade. Hover a dot for its figures; tap one for its page.

0255075100Treorchy (Mid Glamorgan): D− · 1 ha green space per 1,000 · 57% near a park · 1.6 km path per km²Market Weighton (East Riding of Yorkshire): D− · 0.7 ha green space per 1,000 · 79% near a park · 1 km path per km²Beddau (Mid Glamorgan): D · 1 ha green space per 1,000 · 77% near a park · 1.2 km path per km²Old Windsor and Wraysbury (Berkshire): D · 1.2 ha green space per 1,000 · 52% near a park · 2.5 km path per km²Polesworth and Dordon (Warwickshire): D · 1.6 ha green space per 1,000 · 68% near a park · 1.8 km path per km²Deeping St James (Lincolnshire): D · 0.5 ha green space per 1,000 · 73% near a park · 2.4 km path per km²Spencers Wood and Three Mile Cross (Berkshire): D · 0.7 ha green space per 1,000 · 78% near a park · 2.7 km path per km²Shefford (Bedfordshire): D · 1.1 ha green space per 1,000 · 67% near a park · 3 km path per km²Godmanchester (Cambridgeshire): C− · 1.6 ha green space per 1,000 · 66% near a park · 2.7 km path per km²Pickering (North Yorkshire): C− · 1.7 ha green space per 1,000 · 39% near a park · 1.7 km path per km²Breaston and Draycott (Derbyshire): C− · 1.1 ha green space per 1,000 · 73% near a park · 3.2 km path per km²Calverton (Nottinghamshire): C− · 1.7 ha green space per 1,000 · 62% near a park · 3 km path per km²Southwell (Nottinghamshire): C− · 1.7 ha green space per 1,000 · 59% near a park · 3.5 km path per km²Kibworth Beauchamp and Kibworth Harcourt (Leicestershire): C− · 2.1 ha green space per 1,000 · 82% near a park · 2 km path per km²Wivenhoe (Essex): C− · 0.9 ha green space per 1,000 · 65% near a park · 5.1 km path per km²Heathfield (East Sussex): C · 0.9 ha green space per 1,000 · 53% near a park · 2.3 km path per km²Dalton-in-Furness (Cumbria): C · 0.9 ha green space per 1,000 · 74% near a park · 2.4 km path per km²Marske-by-the-Sea (North Yorkshire): C · 1.6 ha green space per 1,000 · 66% near a park · 1.8 km path per km²Fazeley (Staffordshire): C · 3.2 ha green space per 1,000 · 35% near a park · 2.9 km path per km²Newbridge (Gwent): C · 2.2 ha green space per 1,000 · 94% near a park · 1.3 km path per km²Castle Donington (Leicestershire): C · 1.8 ha green space per 1,000 · 85% near a park · 2.4 km path per km²Sawston (Cambridgeshire): C · 1.4 ha green space per 1,000 · 97% near a park · 2.3 km path per km²Elworth (Cheshire): C · 1.8 ha green space per 1,000 · 83% near a park · 2.6 km path per km²Mablethorpe (Lincolnshire): C · 2.1 ha green space per 1,000 · 66% near a park · 1.5 km path per km²Horncastle (Lincolnshire): C · 0.6 ha green space per 1,000 · 60% near a park · 3.9 km path per km²Holywell (Clwyd): C · 0.9 ha green space per 1,000 · 68% near a park · 3 km path per km²Caerleon (Gwent): C · 1.9 ha green space per 1,000 · 64% near a park · 4.2 km path per km²Sprotbrough (South Yorkshire): C+ · 1.8 ha green space per 1,000 · 79% near a park · 3.5 km path per km²Countesthorpe (Leicestershire): C+ · 1.7 ha green space per 1,000 · 100% near a park · 2.1 km path per km²Pelton and Ouston (County Durham): C+ · 2 ha green space per 1,000 · 64% near a park · 4.7 km path per km²Paddock Wood (Kent): C+ · 1.7 ha green space per 1,000 · 78% near a park · 2.1 km path per km²Wrecclesham (Surrey): C+ · 1.2 ha green space per 1,000 · 50% near a park · 3.8 km path per km²Abersychan (Gwent): B− · 2.8 ha green space per 1,000 · 83% near a park · 1.1 km path per km²Yatton (Somerset): B− · 3.7 ha green space per 1,000 · 40% near a park · 2.5 km path per km²Crawcrook and Greenside (Tyne and Wear): B− · 3.2 ha green space per 1,000 · 86% near a park · 2.4 km path per km²Eckington (Derbyshire): B− · 1.8 ha green space per 1,000 · 80% near a park · 6 km path per km²Rogerstone (Gwent): B− · 3.1 ha green space per 1,000 · 60% near a park · 4.7 km path per km²Wootton (Bedfordshire): B− · 2.5 ha green space per 1,000 · 79% near a park · 3.8 km path per km²Berechurch (Essex): B− · 2.1 ha green space per 1,000 · 72% near a park · 10.4 km path per km²Woodville (Derbyshire): B− · 3.7 ha green space per 1,000 · 78% near a park · 3.4 km path per km²Ashley (Hampshire): B · 2.2 ha green space per 1,000 · 53% near a park · 1.7 km path per km²Princes Risborough (Buckinghamshire): B · 1.4 ha green space per 1,000 · 78% near a park · 3.2 km path per km²Wroughton (Wiltshire): B · 1.1 ha green space per 1,000 · 78% near a park · 3.9 km path per km²Barugh Green and Redbrook (South Yorkshire): B · 2.1 ha green space per 1,000 · 94% near a park · 4 km path per km²Partington (Greater Manchester): B · 2.8 ha green space per 1,000 · 100% near a park · 2.7 km path per km²Gowerton (West Glamorgan): B+ · 3.2 ha green space per 1,000 · 79% near a park · 1.2 km path per km²Cromer (Norfolk): B+ · 1.4 ha green space per 1,000 · 74% near a park · 2.5 km path per km²Great Notley (Essex): B+ · 6.4 ha green space per 1,000 · 79% near a park · 4.1 km path per km²Chinnor (Oxfordshire): B+ · 1.5 ha green space per 1,000 · 88% near a park · 3.7 km path per km²Goldthorpe (South Yorkshire): A− · 8.4 ha green space per 1,000 · 84% near a park · 3.8 km path per km²Otford and Kemsing (Kent): A− · 3.3 ha green space per 1,000 · 53% near a park · 3.6 km path per km²Cam (Gloucestershire): A− · 2.8 ha green space per 1,000 · 57% near a park · 5 km path per km²Seaton (Devon): A− · 1.1 ha green space per 1,000 · 84% near a park · 2.5 km path per km²Prestwood and Great Missenden (Buckinghamshire): A− · 5.5 ha green space per 1,000 · 65% near a park · 3.2 km path per km²Bolton upon Dearne (South Yorkshire): A · 5.6 ha green space per 1,000 · 100% near a park · 3.9 km path per km²Bude (Cornwall): A · 3.1 ha green space per 1,000 · 78% near a park · 3.3 km path per km²Ruddington (Nottinghamshire): A · 9.7 ha green space per 1,000 · 100% near a park · 5.1 km path per km²Stocksbridge (South Yorkshire): A · 2.2 ha green space per 1,000 · 100% near a park · 4.4 km path per km²Holbury (Hampshire): A+ · 5.5 ha green space per 1,000 · 89% near a park · 3.1 km path per km²Freshwater and Totland (Isle of Wight): A+ · 5 ha green space per 1,000 · 89% near a park · 3.9 km path per km²Ruddington
Outdoors score: the share of UK towns each one beats
Footpath, km per km²
Ruddington5.1
Towns its size3.0
Nottinghamshire towns3.0
All UK towns3.0
Green space, ha per 1,000 residents
Ruddington9.7
Towns its size1.8
Nottinghamshire towns2.4
All UK towns2.1
Residents within 400 m of a park
Ruddington100%
Towns its size78%
Nottinghamshire towns81%
All UK towns83%

Against towns its size, Ruddington stands out most for park space per resident: none of the other 59 has more.

Show as a table
TownOutdoorsGreen spaceNear a parkPath per km²Protected
1Freshwater and Totland Isle of WightA+589%3.920%
2Holbury HampshireA+5.589%3.142%
3Stocksbridge South YorkshireA2.2100%4.430%
4Ruddington NottinghamshireA9.7100%5.10%
5Bude CornwallA3.178%3.39%
6Bolton upon Dearne South YorkshireA5.6100%3.90%
7Prestwood and Great Missenden BuckinghamshireA−5.565%3.294%
8Seaton DevonA−1.184%2.555%
9Cam GloucestershireA−2.857%534%
10Otford and Kemsing KentA−3.353%3.673%
11Goldthorpe South YorkshireA−8.484%3.80%
12Chinnor OxfordshireB+1.588%3.737%
13Great Notley EssexB+6.479%4.10%
14Cromer NorfolkB+1.474%2.536%
15Gowerton West GlamorganB+3.279%1.214%
16Partington Greater ManchesterB2.8100%2.70%
17Barugh Green and Redbrook South YorkshireB2.194%40%
18Wroughton WiltshireB1.178%3.952%
19Princes Risborough BuckinghamshireB1.478%3.257%
20Ashley HampshireB2.253%1.747%
21Woodville DerbyshireB−3.778%3.40%
22Berechurch EssexB−2.172%10.40%
23Wootton BedfordshireB−2.579%3.80%
24Rogerstone GwentB−3.160%4.70%
25Eckington DerbyshireB−1.880%60%
26Crawcrook and Greenside Tyne and WearB−3.286%2.40%
27Yatton SomersetB−3.740%2.50%
28Abersychan GwentB−2.883%1.117%
29Wrecclesham SurreyC+1.250%3.837%
30Paddock Wood KentC+1.778%2.128%
31Pelton and Ouston County DurhamC+264%4.70%
32Countesthorpe LeicestershireC+1.7100%2.10%
33Sprotbrough South YorkshireC+1.879%3.50%
34Caerleon GwentC1.964%4.20%
35Horncastle LincolnshireC0.660%3.910%
36Holywell ClwydC0.968%30%
37Mablethorpe LincolnshireC2.166%1.50%
38Elworth CheshireC1.883%2.60%
39Sawston CambridgeshireC1.497%2.30%
40Castle Donington LeicestershireC1.885%2.40%
41Newbridge GwentC2.294%1.30%
42Fazeley StaffordshireC3.235%2.90%
43Marske-by-the-Sea North YorkshireC1.666%1.80%
44Dalton-in-Furness CumbriaC0.974%2.40%
45Heathfield East SussexC0.953%2.379%
46Wivenhoe EssexC−0.965%5.10%
47Kibworth Beauchamp and Kibworth Harcourt LeicestershireC−2.182%20%
48Southwell NottinghamshireC−1.759%3.50%
49Calverton NottinghamshireC−1.762%30%
50Breaston and Draycott DerbyshireC−1.173%3.20%
51Pickering North YorkshireC−1.739%1.719%
52Godmanchester CambridgeshireC−1.666%2.70%
53Shefford BedfordshireD1.167%30%
54Spencers Wood and Three Mile Cross BerkshireD0.778%2.70%
55Deeping St James LincolnshireD0.573%2.40%
56Polesworth and Dordon WarwickshireD1.668%1.80%
57Old Windsor and Wraysbury BerkshireD1.252%2.50%
58Beddau Mid GlamorganD177%1.20%
59Market Weighton East Riding of YorkshireD−0.779%10%
60Treorchy Mid GlamorganD−157%1.60%
The map

Parks, footpaths & countryside

Tap a number to zoom to a park. Tap a layer to hide it. The dashed line is Ruddington’s built-up area.

12345
Green space: parks, gardens, playing fields and play spaces, named or not.© OpenStreetMap contributors · Contains OS data © Crown copyright · Natural England / NRW
Places to walk

Parks to walk in, in and around Ruddington

The biggest is Rushcliffe, 83 ha (205 acres). Directions go to the park’s nearest public entrance where Ordnance Survey maps one.

All 5 named parks by size: 93 ha (230 acres) and 14 km of pathRushcliffe83 ha · 13.6 km of pathRushcliffe: 83 ha, 13.6 km of path6 haClifton Football Centre: 5.5 ha, 0.2 km of path4 haElms Park: 4.0 ha, 0.1 km of pathThe Green: 0.3 ha, 0.2 km of pathLace Fields Play Area: 0.1 ha
Parks & gardens 83 haPlaying fields 9.5 haPlay spaces 0.1 ha

The two biggest, Rushcliffe and Clifton Football Centre, are 95% of the named green space and carry 14 km of path between them.

Ruddington’s biggest

Rushcliffe

Park or garden
83 ha (205 acres)13.6 km of path
3 hto walk all 13.6 km of path
116 pitchesfootball pitches would fit
0.4 mi southfrom the centre
Dog park Picnic site Peak 2 playgroundsThe Ladybird TrailMemorial WalkTree Identification Trail+1 path
Directionsto the nearest entrance

Clifton Football Centre

Playing field · 120 m outside town
5.5 ha (14 acres)0.2 km of path
8 pitchesfootball pitches would fit
0.7 mi north-westfrom the centre
Directionsto the nearest entrance

Elms Park

Playing field
4.0 ha (10 acres)0.1 km of path
6 pitchesfootball pitches would fit
0.4 mi south-eastfrom the centre
Directionsto the nearest entrance

The Green

Park or garden
0.3 ha (1 acres)0.2 km of path
Centralin the middle of Ruddington
Directionsto the nearest entrance

Lace Fields Play Area

Play space
0.1 ha (0 acres)
0.6 mi south-eastfrom the centre
Playground
Directionsto the nearest entrance
Close to home

How close Ruddington’s homes are to a park

Each square is 1 in 100 residents: green lives within 400 m of a public park, garden or playing field (Census 2021 output areas against OS Open Greenspace).

Within 400 m (100%)Further (0%)
Ruddington100%
Towns its size78%
Nottinghamshire towns81%
All UK towns83%

Playing fields count, so a park within reach isn’t always one with paths or trees; 37 playgrounds are mapped in and around the town, about one for every 202 residents.

Footpaths & waymarked walks

4 waymarked walks pass through or near Ruddington

67 km of footpaths, bridleways and rights of way are mapped in Ruddington and the kilometre around it, 5.1 km for every square kilometre (the typical UK town has 3.0). Bars show each route’s kilometres within 2 km of the town.

LocalOther waymarked
Rushcliffe Country Park 10km Course9.6 km
Yellow4.0 km
Blue1.9 km
Red1.5 km

Close to home, the Rushcliffe Country Park 10km Course has 10 km of local walk within 2 km of the town.

Waymarked walks are OpenStreetMap walking routes. Public rights of way are only as complete as the map in each area.

When to get out

The best walking months in Ruddington: May to September

The town’s 1991–2020 averages (Met Office HadUK-Grid) and the daylight at its latitude. Outlined months have 12½+ hours of daylight, highs of 15 °C or more and little rain for the town.

JanFebMarAprMayJunJulAugSepOctNovDec
Daylight (h)8.19.811.713.915.816.916.414.712.610.58.67.6
High (°C)891114172023221915118
Rain (mm)474043434457605851605958

February is the driest month (40 mm) and July the warmest (highs of 23 °C). Winter days are short, about 8 hours of daylight in December, and 60 mm of rain falls in October, the wettest month. Frost comes on about 38 nights a year. The climate in Ruddington →

Things to do

37 playgrounds and the nearest beaches

Mapped within 2 km of the town in OpenStreetMap, against the typical UK town its size per resident. Named places are listed with directions; unnamed ones are only counted.

The nearest beaches

Ruddington is inland. These are the nearest named beaches, measured from the edge of the town.

The Beach19 mi from Ruddington’s edge
Directions
Good to know

Check the water before you swim. The Environment Agency tests designated bathing waters from May to September and publishes a rating for each beach.

Every named place, with directions

Hills and peaks 3

Fowemer Hill0.2 mi from town
Directions
Wilford Hill87 m (285 ft) · 0.7 mi from town
Directions
Spinny Hill0.8 mi from town
Directions

Nature reserves 4

Fairham Brook NR11 ha · 0.2 mi from town
Directions
Sharphill Wood Local Nature Reserve11 ha · 0.6 mi from town
Directions
Glapton Wood Nature Reserve3.4 ha · 0.7 mi from town
Directions
Wilford Clay Pit NR3.5 ha · 0.9 mi from town
Directions

Picnic sites 4

Willow Weave Picnic Area0.2 mi from town
Directions

Plus 3 picnic sites without a name on the map.

Playgrounds 37

Lace Fields Play Areain town
Directions
Sensory Trail0.2 mi from town
Directions
Children's Play Area0.2 mi from town
Directions
Breckswood Park Play Area0.4 mi from town
Directions
Shalimar Playground0.7 mi from town
Directions
Silverdale Play Area1.0 mi from town
Directions

Plus 31 playgrounds without a name on the map.

Dog parks 1

Dog Activity Trail0.3 mi from town
Directions
Next door

The outdoors in nearby towns

The nearest towns of 1,000+ within 12 miles. Tap a town for its outdoors page.

ABCDOutdoors Grade
TownOutdoorsGreen space, ha per 1,000Near a parkProtected within 5 km
RuddingtonA9.7100%0%
Clifton 1.4 miC+1.576%0%
Edwalton 1.9 miC+2.158%0%
Wilford 2.0 miA7.793%0%
West Bridgford 2.4 miB+2.286%0%
Tollerton 2.5 miD−0.619%0%
Gotham 2.8 miB−3.983%0%

Ruddington grades higher for the outdoors than every neighbour in the table. None of the neighbours has a protected landscape within 5 km either.

Questions about the outdoors in Ruddington

What is the biggest park in Ruddington?

Rushcliffe, 83 ha (205 acres), with 13.6 km of path. Clifton Football Centre (5.5 ha) is second. 5 named parks, gardens and playing fields are in the town or within 400 m of it.

Is Ruddington near a National Park?

No National Park or National Landscape is within 30 km (about 19 miles) of Ruddington.

What are the best walks near Ruddington?

4 waymarked walking routes pass within 2 km of the town, including the Rushcliffe Country Park 10km Course, Yellow and Blue. Rushcliffe alone has 13.6 km of path.

What is the nearest beach to Ruddington?

The Beach, 19 mi from the edge of the town. Ruddington itself is inland.

How many people in Ruddington live near a park?

100% of residents live within 400 m, about a 5-minute walk, of a public park, garden or playing field (Census 2021 output areas against OS Open Greenspace). The typical UK town is 83%.

When is the best time of year for walking in Ruddington?

May to September: the longest days, the warmest afternoons and the least rain of the year, from the Met Office 1991–2020 averages.

Is Ruddington good for walking?

For paths, yes: 5.1 km of footpath and right of way per square kilometre, more than 93% of UK towns. For park space per person it beats 96% (9.7 ha per 1,000 residents).

How is the Outdoors Grade worked out?

From five measures, each placed among UK towns of 1,000 or more: public green space per resident, the share living near a park, National Park or National Landscape within 5 km, footpaths per square kilometre, and the sea within 5 km. It is a character grade and isn’t part of Ruddington’s overall grade.

Sources

Where Ruddington’s outdoors figures come from

  • Parks and green space: Ordnance Survey OS Open Greenspace (parks and gardens, playing fields, play spaces, and their access points). Contains OS data © Crown copyright and database right 2026, Open Government Licence v3.0.
  • National Parks and National Landscapes: Natural England and Natural Resources Wales boundaries, areas and designation dates, Open Government Licence v3.0.
  • Footpaths, walking routes, beaches and things to do: © OpenStreetMap contributors, Open Database License (ODbL), via Geofabrik, 16 October 2026.
  • Historic parks, listed buildings and monuments: Historic England, National Heritage List for England, Open Government Licence v3.0.
  • Rain and temperature: Met Office HadUK-Grid 1991–2020 averages for the town; daylight calculated from its latitude.
  • The sea: ONS Countries (December 2024) boundaries clipped to mean high water. Residents near a park: ONS Census 2021 output areas.
  • Grade: TownRatings’ Outdoors Grade, ranked against UK towns only.

Contains public sector information licensed under the Open Government Licence v3.0. Contains HM Land Registry data © Crown copyright and database right 2026. Contains OS data © Crown copyright and database right 2026 (ONS boundaries). Northern Ireland: Source: NISRA; contains Land & Property Services data and Ordnance Survey of Northern Ireland information, © Crown copyright, licensed under the Open Government Licence v3.0. Scotland: contains National Records of Scotland data, Registers of Scotland data and SEPA data, © Crown copyright / © SEPA 2025, licensed under the Open Government Licence v3.0.