Heacham’s biggest
Brays Pit
Park or garden
1.1 ha (3 acres)
Centralin the middle of Heacham
Directionsto the nearest entrance
Each edition grades its towns against each other only.
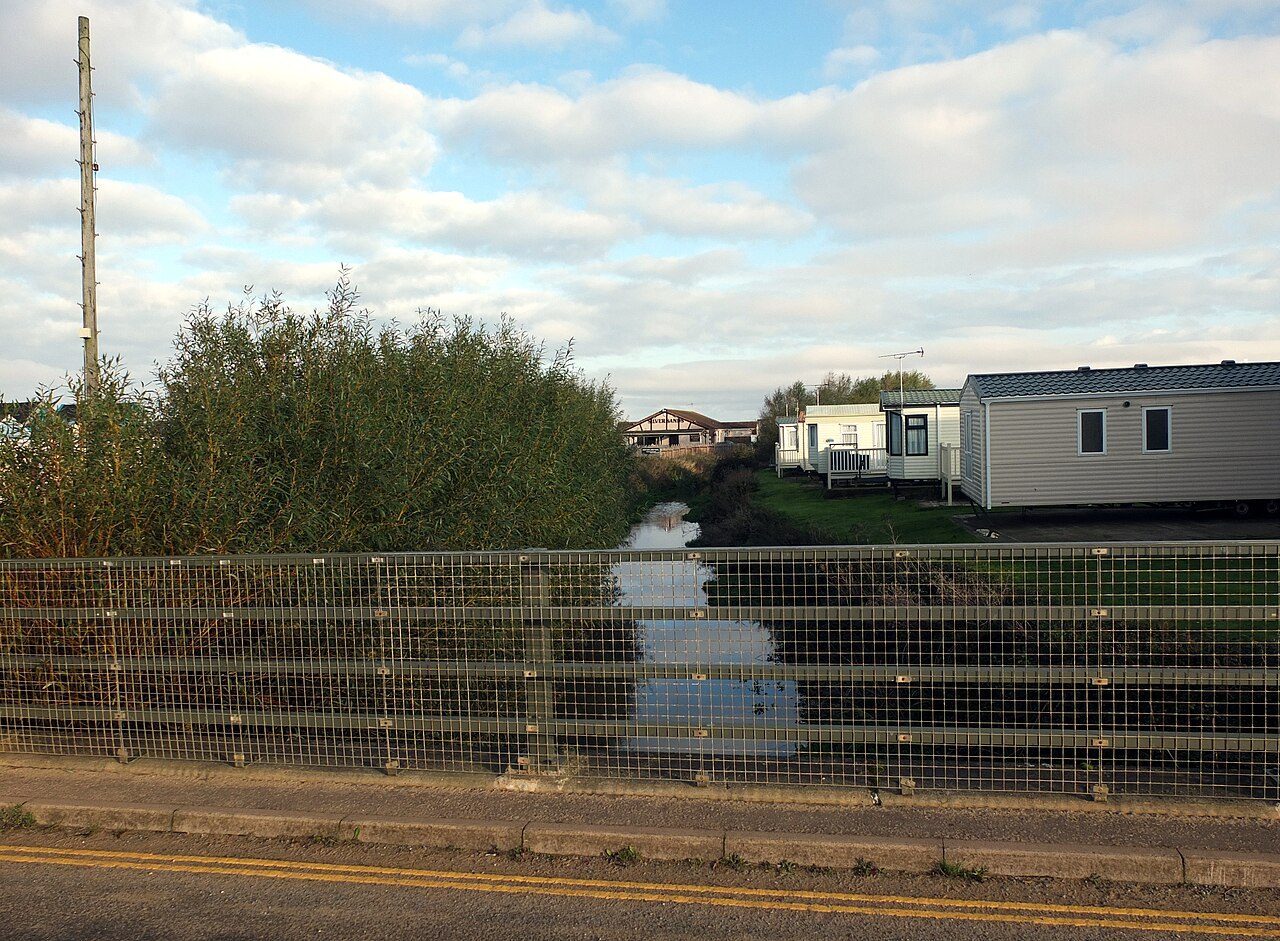 Photo: habiloid · CC BY-SA 2.0
The sea makes up 38% of the area within 5 km. The Norfolk Coast National Landscape reaches the edge of Heacham. Footpaths add up to 17 km in the town and the kilometre around it, 1.1 for every square kilometre. Heacham grades C+ for the outdoors: #28 of 51 in Norfolk. A character grade: it isn’t part of the overall grade.
Read from the data: what stands out first, good and bad.
Heacham’s strongest suit is the sea, followed by protected countryside on the doorstep. Where it falls short is footpaths.
Each chart is every UK town of 1,000 or more on one measure: the green bar is Heacham, the dashed line the typical town. The number is the share of towns it beats; the five are averaged and the average ranked again.
Graded, never part of the overall grade (like History and Civic life). It measures what is mapped: OS Open Greenspace leaves out woodland and open-access land that isn’t a park, and OpenStreetMap’s rural paths are more complete in some places than others.
The 60 UK towns and cities of 3,800 to 4,100 people with an Outdoors Grade. Hover a dot for its figures; tap one for its page.
Heacham falls furthest behind on path per km², where 52 of the 59 others do better.
| Town | Outdoors | Green space | Near a park | Path per km² | Protected | |
|---|---|---|---|---|---|---|
| 1 | Darley Dale Derbyshire | A+ | 3.8 | 100% | 3.4 | 51% |
| 2 | Batheaston Somerset | A | 3 | 84% | 4.6 | 71% |
| 3 | Cranbrook Kent | A | 5.8 | 82% | 2.9 | 65% |
| 4 | Chickerell Dorset | A | 1.5 | 88% | 3 | 27% |
| 5 | Bisley Surrey | A | 8 | 92% | 4.8 | 0% |
| 6 | Walter's Ash and Naphill Buckinghamshire | A | 3.7 | 50% | 5.3 | 79% |
| 7 | Holt Norfolk | A | 8.5 | 84% | 2.4 | 40% |
| 8 | Old Sarum Wiltshire | A | 4.6 | 100% | 3.7 | 0% |
| 9 | Disley Cheshire | A− | 1.2 | 100% | 4.6 | 22% |
| 10 | Bowerhill Wiltshire | A− | 7.4 | 100% | 3 | 0% |
| 11 | Prestbury Gloucestershire | A− | 1.6 | 80% | 5.3 | 51% |
| 12 | Welwyn Hertfordshire | A− | 2.6 | 100% | 4 | 0% |
| 13 | Esh Winning County Durham | A− | 3.2 | 100% | 3.5 | 0% |
| 14 | Carbis Bay Cornwall | B+ | 0.5 | 88% | 2.8 | 20% |
| 15 | Long Melford Suffolk | B+ | 6.9 | 87% | 3.3 | 0% |
| 16 | Cheddleton Staffordshire | B+ | 3.5 | 88% | 3.6 | 0% |
| 17 | Chirk Clwyd | B+ | 1.8 | 100% | 2.3 | 15% |
| 18 | Queenborough Kent | B | 1.6 | 100% | 2 | 0% |
| 19 | Tangmere West Sussex | B | 2.1 | 100% | 1.2 | 36% |
| 20 | Stoke Poges Buckinghamshire | B | 7.7 | 76% | 3.3 | 0% |
| 21 | Pirbright Surrey | B | 2 | 84% | 5.7 | 0% |
| 22 | Grange-over-Sands Cumbria | B | 1.5 | 46% | 2.6 | 40% |
| 23 | Calverley West Yorkshire | B | 1.5 | 92% | 6 | 0% |
| 24 | Little Paxton Cambridgeshire | B− | 2.8 | 87% | 3 | 0% |
| 25 | Tumble Dyfed | B− | 19.5 | 93% | 1.5 | 0% |
| 26 | Stoney Stanton Leicestershire | B− | 2.5 | 100% | 2.2 | 0% |
| 27 | Martock Somerset | B− | 2.9 | 85% | 3 | 0% |
| 28 | South Cerney Gloucestershire | B− | 2.5 | 77% | 2.4 | 7% |
| 29 | Lower Stondon Bedfordshire | B− | 2.7 | 73% | 2.2 | 5% |
| 30 | New Romney Kent | C+ | 2.5 | 79% | 1.6 | 0% |
| 31 | Ystradgynlais Powys | C+ | 2.5 | 78% | 1.2 | 36% |
| 32 | Chipping Ongar Essex | C+ | 2.5 | 83% | 2.9 | 0% |
| 33 | Bar Hill Cambridgeshire | C+ | 1.4 | 93% | 3.5 | 0% |
| 34 | Heacham Norfolk | C+ | 1.5 | 53% | 1.1 | 29% |
| 35 | Forest Row East Sussex | C+ | 0.3 | 51% | 3.4 | 94% |
| 36 | Shirland and Stonebroom Derbyshire | C | 3.7 | 43% | 3 | 0% |
| 37 | Kirkburton West Yorkshire | C | 1.4 | 86% | 3.3 | 0% |
| 38 | South Darenth and Sutton at Hone Kent | C | 1.8 | 43% | 2.7 | 10% |
| 39 | Silver End Essex | C | 2 | 88% | 2.1 | 0% |
| 40 | Langley Park County Durham | C | 0.8 | 84% | 3.8 | 0% |
| 41 | Cubbington Warwickshire | C | 1.5 | 100% | 1.7 | 0% |
| 42 | Tenbury Wells Worcestershire | C | 2.3 | 51% | 2.1 | 3% |
| 43 | Oaklands Hertfordshire | C | 2 | 7% | 4.3 | 0% |
| 44 | Wynyard County Durham | C | 10.7 | 64% | 1.3 | 0% |
| 45 | Great Glen Leicestershire | C | 1.4 | 91% | 2.2 | 0% |
| 46 | Whiston South Yorkshire | C− | 1 | 75% | 3.8 | 0% |
| 47 | Lydd Kent | C− | 1.7 | 66% | 0.9 | 0% |
| 48 | Brookmans Park Hertfordshire | C− | 2.5 | 43% | 2.5 | 0% |
| 49 | Kingston Bagpuize Oxfordshire | C− | 0.8 | 100% | 1.3 | 0% |
| 50 | Swanland East Riding of Yorkshire | C− | 1.1 | 75% | 0.3 | 0% |
| 51 | Sutton Cambridgeshire | D | 1.9 | 82% | 1.1 | 0% |
| 52 | Glyn-neath West Glamorgan | D | 1.3 | 57% | 1.1 | 22% |
| 53 | Crowle Lincolnshire | D | 1.3 | 91% | 1 | 0% |
| 54 | Doddinghurst Essex | D | 1.6 | 60% | 2.4 | 0% |
| 55 | Sutton Bridge Lincolnshire | D | 1.3 | 79% | 0.8 | 0% |
| 56 | North Ferriby East Riding of Yorkshire | D | 0.6 | 33% | 1 | 0% |
| 57 | Gnosall Staffordshire | D | 1.2 | 42% | 2.3 | 0% |
| 58 | Cricklade Wiltshire | D | 0.3 | 9% | 3 | 0% |
| 59 | Willingham Cambridgeshire | D | 1.4 | 73% | 0.8 | 0% |
| 60 | Indian Queens, Fraddon and St Columb Road Cornwall | D− | 0.7 | 27% | 1.6 | 0% |
Tap a number to zoom to a park. Tap a layer to hide it. The dashed line is Heacham’s built-up area.
The biggest is Brays Pit, 1.1 ha (3 acres). Directions go to the park’s nearest public entrance where Ordnance Survey maps one.
Each square is 1 in 100 residents: green lives within 400 m of a public park, garden or playing field (Census 2021 output areas against OS Open Greenspace).
About 1,900 people live further than that. Playing fields count, so a park within reach isn’t always one with paths or trees; 6 playgrounds are mapped in and around the town, about one for every 663 residents.
Protected landscapes within 30 km, by direction and distance from the edge of the built-up area; circle size shows each one’s area. National Landscapes were called Areas of Outstanding Natural Beauty until 2023.
29% of the land within 5 km of Heacham is National Park or National Landscape, more than 82% of UK towns.
17 km of footpaths, bridleways and rights of way are mapped in Heacham and the kilometre around it, 1.1 km for every square kilometre (the typical UK town has 3.0). Bars show each route’s kilometres within 2 km of the town.
The Norfolk Coast Path, a national route, passes Heacham. Close to home, the Heacham Circular has 7 km of local walk within 2 km of the town. The regional route here is the Elizabeth Way.
Waymarked walks are OpenStreetMap walking routes. Public rights of way are only as complete as the map in each area.
The town’s 1991–2020 averages (Met Office HadUK-Grid) and the daylight at its latitude. Outlined months have 12½+ hours of daylight, highs of 15 °C or more and little rain for the town.
| Jan | Feb | Mar | Apr | May | Jun | Jul | Aug | Sep | Oct | Nov | Dec | |
|---|---|---|---|---|---|---|---|---|---|---|---|---|
| Daylight (h) | 8.1 | 9.8 | 11.7 | 13.9 | 15.8 | 16.9 | 16.4 | 14.7 | 12.6 | 10.5 | 8.6 | 7.6 |
| High (°C) | 7 | 8 | 10 | 14 | 17 | 20 | 22 | 22 | 19 | 15 | 11 | 8 |
| Rain (mm) | 53 | 37 | 37 | 39 | 43 | 57 | 57 | 55 | 53 | 63 | 63 | 55 |
March is the driest month (37 mm) and July the warmest (highs of 22 °C). Winter days are short, about 8 hours of daylight in December, and 63 mm of rain falls in November, the wettest month. Frost comes on about 30 nights a year. The climate in Heacham →
38% of the area within 5 km of Heacham is sea. 6 beaches are mapped within 5 km, 1 with a name.
The Norfolk Coast Path passes the town.
Sea: the area outside the ONS coastline (mean high water). Bathing water quality is published by the Environment Agency (England) and Natural Resources Wales; check it before swimming.
Mapped within 2 km of the town in OpenStreetMap, against the typical UK town its size per resident. Named places are listed with directions; unnamed ones are only counted.
Plus 6 playgrounds without a name on the map.
The nearest towns of 1,000+ within 12 miles. Tap a town for its outdoors page.
| Town | Outdoors | Green space, ha per 1,000 | Near a park | Protected within 5 km |
|---|---|---|---|---|
| Heacham | C+ | 1.5 | 53% | 29% |
| Hunstanton 2.0 mi | A− | 3.7 | 71% | 31% |
| Snettisham 2.2 mi | C+ | 1.1 | 73% | 32% |
| Dersingham 4.2 mi | A− | 3.1 | 76% | 39% |
| King's Lynn 10.6 mi | C+ | 1.3 | 80% | 23% |
| Gayton 11.6 mi | D− | 1.6 | 62% | 0% |
| Clenchwarton 11.9 mi | C | 2.2 | 87% | 3% |
Dersingham, 4.2 miles away, grades A−, the best next door: 76% of its residents live within 400 m of a park. Hunstanton and Dersingham have at least twice Heacham’s green space per resident.
Brays Pit, 1.1 ha (3 acres). 1 named park, garden or playing field is in the town or within 400 m of it.
It covers 446 km² and was designated in 1968.
5 waymarked walking routes pass within 2 km of the town, including the Heacham Circular, Norfolk Coast Path and King Charles III England Coast Path: Hunstanton to Sutton Bridge.
53% of residents live within 400 m, about a 5-minute walk, of a public park, garden or playing field (Census 2021 output areas against OS Open Greenspace). The typical UK town is 83%.
May to September: the longest days, the warmest afternoons and the least rain of the year, from the Met Office 1991–2020 averages.
Paths are thinner than most towns: 1.1 km of footpath and right of way per square kilometre, more than 9% of UK towns. For park space per person it beats 28% (1.5 ha per 1,000 residents).
From five measures, each placed among UK towns of 1,000 or more: public green space per resident, the share living near a park, National Park or National Landscape within 5 km, footpaths per square kilometre, and the sea within 5 km. It is a character grade and isn’t part of Heacham’s overall grade.
Contains public sector information licensed under the Open Government Licence v3.0. Contains HM Land Registry data © Crown copyright and database right 2026. Contains OS data © Crown copyright and database right 2026 (ONS boundaries). Northern Ireland: Source: NISRA; contains Land & Property Services data and Ordnance Survey of Northern Ireland information, © Crown copyright, licensed under the Open Government Licence v3.0. Scotland: contains National Records of Scotland data, Registers of Scotland data and SEPA data, © Crown copyright / © SEPA 2025, licensed under the Open Government Licence v3.0.