Northfleet’s biggest
Woodlands Park
Park or garden
5.8 ha (14 acres)1.2 km of path
15 minto walk all 1.2 km of path
8 pitchesfootball pitches would fit
0.7 mi eastfrom the centre
Directionsto the nearest entrance
Each edition grades its towns against each other only.
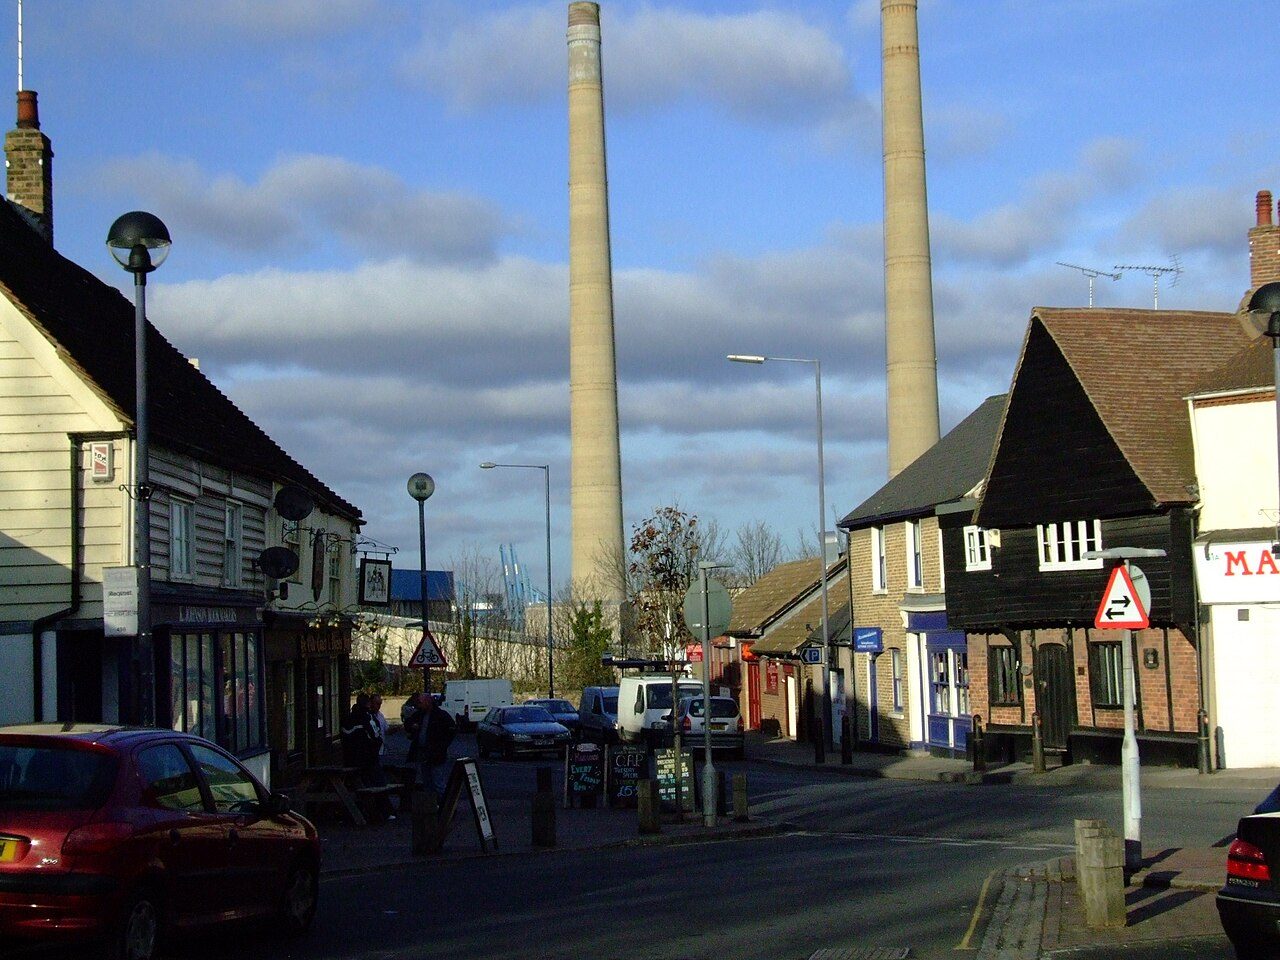 Photo: Clem Rutter, Rochester, Kent. · CC BY 2.5
The sea makes up 9% of the area within 5 km. Footpaths add up to 194 km in the town and the kilometre around it, 7.7 for every square kilometre. The Kent Downs National Landscape begins 2.1 mi from the town’s edge. Northfleet grades A for the outdoors: #14 of 87 in Kent. A character grade: it isn’t part of the overall grade.
Read from the data: what stands out first, good and bad.
Northfleet’s strongest suit is the sea, followed by dense footpaths.
Each chart is every UK town of 1,000 or more on one measure: the green bar is Northfleet, the dashed line the typical town. The number is the share of towns it beats; the five are averaged and the average ranked again.
Graded, never part of the overall grade (like History and Civic life). It measures what is mapped: OS Open Greenspace leaves out woodland and open-access land that isn’t a park, and OpenStreetMap’s rural paths are more complete in some places than others.
The 60 UK towns and cities of 27,400 to 32,600 people with an Outdoors Grade. Hover a dot for its figures; tap one for its page.
Against towns its size, Northfleet stands out most for path per km²: none of the other 59 has more.
| Town | Outdoors | Green space | Near a park | Path per km² | Protected | |
|---|---|---|---|---|---|---|
| 1 | Yate Gloucestershire | A+ | 4.3 | 99% | 6.8 | 11% |
| 2 | Jarrow Tyne and Wear | A+ | 5.3 | 90% | 6.1 | 0% |
| 3 | Northfleet Kent | A | 2 | 85% | 7.7 | 4% |
| 4 | Ashington Northumberland | A | 5.6 | 83% | 3.9 | 0% |
| 5 | Penarth South Glamorgan | A | 3.5 | 83% | 4.1 | 0% |
| 6 | Witney Oxfordshire | A | 2.5 | 88% | 4.6 | 19% |
| 7 | Woodley Berkshire | A | 5 | 81% | 4.3 | 1% |
| 8 | Lancing and Sompting West Sussex | A | 1.8 | 80% | 3 | 37% |
| 9 | Prestwich Greater Manchester | A | 9 | 94% | 4.1 | 0% |
| 10 | Totton Hampshire | A | 1.6 | 94% | 4.4 | 50% |
| 11 | Burntwood Staffordshire | A− | 5.3 | 81% | 3.4 | 12% |
| 12 | Redhill Surrey | A− | 2.2 | 91% | 4.3 | 14% |
| 13 | Ewell Surrey | A− | 7.5 | 89% | 4.4 | 0% |
| 14 | Chandler's Ford Hampshire | A− | 2.7 | 80% | 5.3 | 6% |
| 15 | Stretford Greater Manchester | A− | 3.7 | 92% | 4.9 | 0% |
| 16 | Great Yarmouth Norfolk | A− | 1.7 | 73% | 3.2 | 18% |
| 17 | Cleethorpes Lincolnshire | A− | 3 | 84% | 2.7 | 0% |
| 18 | Daventry Northamptonshire | A− | 4.1 | 99% | 3.3 | 0% |
| 19 | Eston North Yorkshire | B+ | 2.9 | 93% | 2.8 | 2% |
| 20 | Harpenden Hertfordshire | B+ | 3.5 | 84% | 2.9 | 2% |
| 21 | Cramlington Northumberland | B+ | 2.3 | 91% | 6.6 | 0% |
| 22 | Deal Kent | B+ | 1 | 86% | 2.7 | 6% |
| 23 | Farnworth Greater Manchester | B+ | 3 | 85% | 4.4 | 0% |
| 24 | Chichester West Sussex | B+ | 1.6 | 89% | 3 | 40% |
| 25 | Pontypool Gwent | B+ | 3.6 | 93% | 1.8 | 7% |
| 26 | Brierley Hill West Midlands | B+ | 3.1 | 82% | 4.6 | 0% |
| 27 | Colwyn Bay Clwyd | B+ | 1.9 | 77% | 2.4 | 0% |
| 28 | Windsor Berkshire | B | 5.5 | 83% | 3.3 | 0% |
| 29 | Shipley West Yorkshire | B | 2.1 | 87% | 6 | 0% |
| 30 | Consett County Durham | B | 1.7 | 87% | 3.1 | 19% |
| 31 | Darwen Lancashire | B | 2.2 | 89% | 4.5 | 0% |
| 32 | Egham Surrey | B | 4.1 | 63% | 4.9 | 0% |
| 33 | Bushey Hertfordshire | B | 3.1 | 77% | 4 | 0% |
| 34 | Atherton Greater Manchester | B | 3.8 | 83% | 3.1 | 0% |
| 35 | Evesham Worcestershire | B− | 1.7 | 80% | 3.5 | 4% |
| 36 | Stanford-le-Hope Essex | B− | 2.6 | 84% | 1.4 | 0% |
| 37 | Radcliffe Greater Manchester | B− | 1.7 | 86% | 4.2 | 0% |
| 38 | Whitstable Kent | B− | 1.5 | 84% | 2.3 | 0% |
| 39 | Melton Mowbray Leicestershire | B− | 3.3 | 84% | 2.4 | 0% |
| 40 | Kendal Cumbria | C+ | 0.9 | 67% | 4 | 33% |
| 41 | Winsford Cheshire | C+ | 1.3 | 92% | 3.9 | 0% |
| 42 | Newton Abbot Devon | C+ | 2.6 | 62% | 2.3 | 6% |
| 43 | Stratford-upon-Avon Warwickshire | C | 1.6 | 84% | 3.2 | 0% |
| 44 | Newark-on-Trent Nottinghamshire | C | 2.2 | 91% | 2 | 0% |
| 45 | Bedworth Warwickshire | C | 1.5 | 87% | 2.9 | 0% |
| 46 | Barnstaple Devon | C | 1.6 | 92% | 2.4 | 0% |
| 47 | Frome Somerset | C | 1.3 | 78% | 2.4 | 9% |
| 48 | Rayleigh Essex | C | 2 | 71% | 3.1 | 0% |
| 49 | Beverley East Riding of Yorkshire | C | 0.7 | 92% | 2.9 | 0% |
| 50 | Wickford Essex | C | 2.4 | 59% | 3 | 0% |
| 51 | Sedgley West Midlands | C | 1.5 | 65% | 4 | 0% |
| 52 | Congleton Cheshire | C | 1.7 | 72% | 3.1 | 0% |
| 53 | Hertford Hertfordshire | C | 0.9 | 65% | 5.3 | 0% |
| 54 | Rushden Northamptonshire | C− | 1.5 | 84% | 2.4 | 0% |
| 55 | Heywood Greater Manchester | C− | 1.3 | 80% | 2.8 | 0% |
| 56 | Heswall Merseyside | C− | 1.1 | 56% | 2.3 | 0% |
| 57 | Port Talbot West Glamorgan | C− | 1.3 | 68% | 1.1 | 0% |
| 58 | Ormskirk Lancashire | D | 1.5 | 80% | 1.8 | 0% |
| 59 | Spalding Lincolnshire | D | 1.1 | 85% | 1.5 | 0% |
| 60 | Pontypridd Mid Glamorgan | D | 1.5 | 70% | 1.9 | 0% |
Tap a number to zoom to a park. Tap a layer to hide it. The dashed line is Northfleet’s built-up area.
The biggest is Woodlands Park, 5.8 ha (14 acres). Directions go to the park’s nearest public entrance where Ordnance Survey maps one.
The two biggest, Woodlands Park and Wombwell Park, are 70% of the named green space and carry 2 km of path between them. 4 of the 6 are under 2 ha: small gardens, play spaces and pitches.
Each square is 1 in 100 residents: green lives within 400 m of a public park, garden or playing field (Census 2021 output areas against OS Open Greenspace).
About 4,000 people live further than that. Playing fields count, so a park within reach isn’t always one with paths or trees; 87 playgrounds are mapped in and around the town, about one for every 344 residents.
Protected landscapes within 30 km, by direction and distance from the edge of the built-up area; circle size shows each one’s area. National Landscapes were called Areas of Outstanding Natural Beauty until 2023.
4% of the land within 5 km of Northfleet is National Park or National Landscape, more than 67% of UK towns.
194 km of footpaths, bridleways and rights of way are mapped in Northfleet and the kilometre around it, 7.7 km for every square kilometre (the typical UK town has 3.0). Bars show each route’s kilometres within 2 km of the town.
The King Charles III England Coast Path, a national route, passes Northfleet. 3 regional routes pass through, including the Wealdway, 1066 Harold's Way and Saxon Shore Way.
Waymarked walks are OpenStreetMap walking routes. Public rights of way are only as complete as the map in each area.
Historic England’s register of parks and gardens, and the listed buildings and scheduled monuments that stand inside Northfleet’s named parks.
A listed building or monument counts when it sits inside the park’s OS Open Greenspace outline (to about 15 m), so a few at the boundary are included. Historic England, National Heritage List for England.
The town’s 1991–2020 averages (Met Office HadUK-Grid) and the daylight at its latitude. Outlined months have 12½+ hours of daylight, highs of 15 °C or more and little rain for the town.
| Jan | Feb | Mar | Apr | May | Jun | Jul | Aug | Sep | Oct | Nov | Dec | |
|---|---|---|---|---|---|---|---|---|---|---|---|---|
| Daylight (h) | 8.3 | 9.9 | 11.7 | 13.8 | 15.6 | 16.6 | 16.2 | 14.6 | 12.5 | 10.6 | 8.8 | 7.9 |
| High (°C) | 8 | 9 | 11 | 15 | 18 | 22 | 24 | 23 | 20 | 16 | 12 | 9 |
| Rain (mm) | 52 | 38 | 33 | 36 | 43 | 45 | 40 | 51 | 45 | 57 | 60 | 53 |
March is the driest month (33 mm) and July the warmest (highs of 24 °C). Winter days are short, about 8 hours of daylight in December, and 60 mm of rain falls in November, the wettest month. Frost comes on about 30 nights a year. The climate in Northfleet →
9% of the area within 5 km of Northfleet is sea. 14 beaches are mapped within 5 km, 1 with a name.
The King Charles III England Coast Path passes the town.
Sea: the area outside the ONS coastline (mean high water). Bathing water quality is published by the Environment Agency (England) and Natural Resources Wales; check it before swimming.
Mapped within 2 km of the town in OpenStreetMap, against the typical UK town its size per resident. Named places are listed with directions; unnamed ones are only counted.
Plus 1 viewpoint without a name on the map.
Plus 1 nature reserve without a name on the map.
Plus 80 playgrounds without a name on the map.
Plus 1 slipway without a name on the map.
The nearest towns of 1,000+ within 12 miles. Tap a town for its outdoors page.
| Town | Outdoors | Green space, ha per 1,000 | Near a park | Protected within 5 km |
|---|---|---|---|---|
| Northfleet | A | 2.0 | 85% | 4% |
| Gravesend 1.6 mi | A | 1.4 | 84% | 14% |
| Ebbsfleet Valley 1.6 mi | A | 9.0 | 77% | 0% |
| Istead Rise 2.1 mi | B− | 1.9 | 82% | 15% |
| Tilbury 2.2 mi | B | 1.4 | 98% | 0% |
| Swanscombe 2.4 mi | A+ | 3.3 | 90% | 0% |
| Bean 2.6 mi | A− | 17.0 | 72% | 0% |
Swanscombe, 2.4 miles away, grades A+, the best next door: 90% of its residents live within 400 m of a park. Ebbsfleet Valley and Bean have at least twice Northfleet’s green space per resident.
Woodlands Park, 5.8 ha (14 acres), with 1.2 km of path. Wombwell Park (4.3 ha) is second. 6 named parks, gardens and playing fields are in the town or within 400 m of it.
The nearest protected landscape is the Kent Downs National Landscape, 2.1 mi south-east of the town’s edge. It covers 879 km² and was designated in 1968.
7 waymarked walking routes pass within 2 km of the town, including the King Charles III England Coast Path: Grain to Woolwich, Wealdway and 1066 Harold's Way.
85% of residents live within 400 m, about a 5-minute walk, of a public park, garden or playing field (Census 2021 output areas against OS Open Greenspace). The typical UK town is 83%.
May to September: the longest days, the warmest afternoons and the least rain of the year, from the Met Office 1991–2020 averages.
Gravesend Cemetery (Grade II*) is on Historic England’s register of parks and gardens.
For paths, yes: 7.7 km of footpath and right of way per square kilometre, more than 99% of UK towns. For park space per person it beats 45% (2.0 ha per 1,000 residents).
From five measures, each placed among UK towns of 1,000 or more: public green space per resident, the share living near a park, National Park or National Landscape within 5 km, footpaths per square kilometre, and the sea within 5 km. It is a character grade and isn’t part of Northfleet’s overall grade.
Contains public sector information licensed under the Open Government Licence v3.0. Contains HM Land Registry data © Crown copyright and database right 2026. Contains OS data © Crown copyright and database right 2026 (ONS boundaries). Northern Ireland: Source: NISRA; contains Land & Property Services data and Ordnance Survey of Northern Ireland information, © Crown copyright, licensed under the Open Government Licence v3.0. Scotland: contains National Records of Scotland data, Registers of Scotland data and SEPA data, © Crown copyright / © SEPA 2025, licensed under the Open Government Licence v3.0.