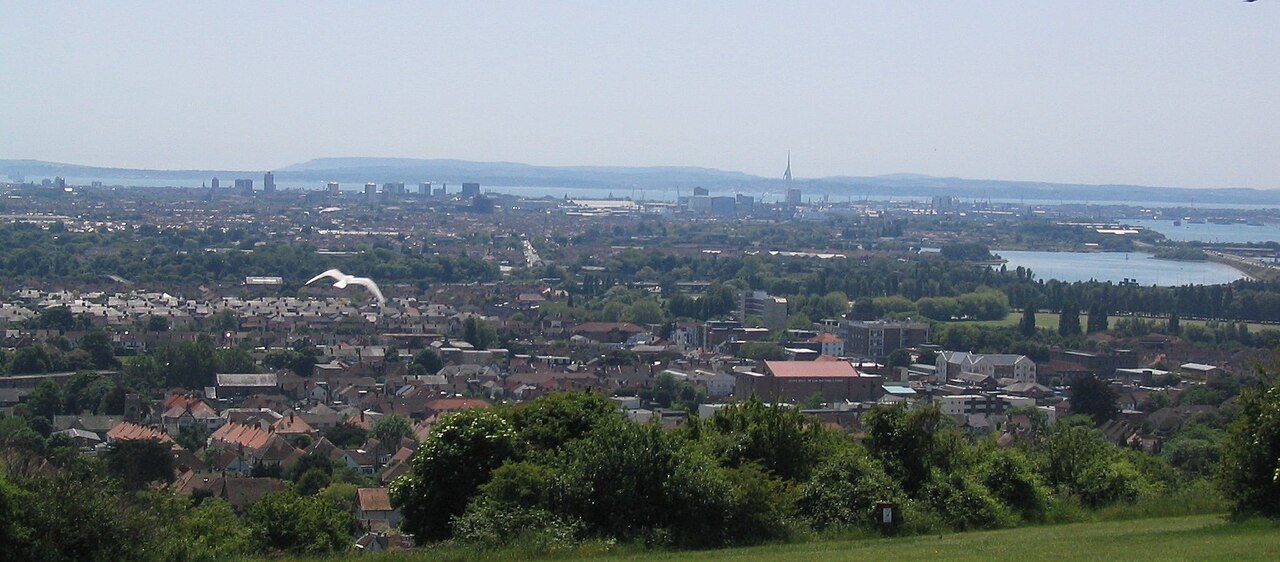
 Photo: AlanFord · Public domain
Few UK towns have warmer summer afternoons than Portsmouth
Deep winter brings January lows near 2.8°C (37°F). Of all months, November brings the most rain and May the least. By frosts alone, it ranks gentler than 92% of UK towns. The heating season runs November to March: each of those months averages under 10°C.
Met Office 1991–2020 averages for the town itself.
A year in Portsmouth at a glance
Each month’s typical high and low, in °C.
What a year in Portsmouth feels like
Typical highs and lows by season and by month, from the Met Office’s 1991–2020 averages.
About 774 mm of rain a year
November is the wettest month and May the driest. About 23 days a year bring 10 mm (0.4 in) or more. 62nd wettest of 77 Hampshire towns of 2,500+.
Rain by month
Millimetres
Sunshine by month
Hours of bright sunshine at Hurn (Bournemouth Airport)
23 air frosts and 12 days of 25°C a year
On about 23 nights a year the air drops below freezing, and on about under 1 days it stays below freezing all day. About 12 days a year reach 25°C (77°F).
Day counts are 1991–2020 averages from the Met Office’s 2 km grid. The Met Office calls a day of 25°C or more a summer day and a night below 0°C an air frost; ground frosts, on grass, come more often.
The Met Office station at Hurn (Bournemouth Airport)
Hurn (Bournemouth Airport) is 33 miles west of Portsmouth, 10 m (33 ft) above sea level. It is the nearest of the 37 long-running stations the Met Office publishes in full; at that distance read it for sunshine and the station’s own record, not as the town’s figures.
| Month | High | Low | Rain | Air frosts | Sun (hours) |
|---|---|---|---|---|---|
| January | 8.8°C | 1.8°C | 96 mm | 11.1 | 65 |
| February | 9.1°C | 1.6°C | 67 mm | 10.9 | 80 |
| March | 11.4°C | 2.8°C | 62 mm | 8.3 | 122 |
| April | 14.2°C | 4.3°C | 58 mm | 4.7 | 178 |
| May | 17.4°C | 7.3°C | 49 mm | 0.6 | 211 |
| June | 20.1°C | 10.2°C | 54 mm | 0.0 | 217 |
| July | 22.3°C | 12.2°C | 50 mm | 0.0 | 221 |
| August | 22.0°C | 12.0°C | 60 mm | 0.0 | 198 |
| September | 19.6°C | 9.6°C | 69 mm | 0.0 | 156 |
| October | 15.6°C | 7.4°C | 101 mm | 2.2 | 108 |
| November | 11.8°C | 4.1°C | 108 mm | 6.9 | 76 |
| December | 9.2°C | 2.0°C | 104 mm | 11.6 | 59 |
| Year | 15.1°C | 6.3°C | 877 mm | 56 | 1,690 |
Met Office historic station data, Hurn, 1991–2020 months averaged (a month needs 20 of the 30 years; estimated values counted, missing months left out). Sunshine: Kipp & Zonen recorder.
How Portsmouth compares
Against the 2,537 towns and cities of 2,500 or more across the UK, each with its own Met Office averages, and its place among Hampshire towns that size.
Nearby towns’ climate
The nearest towns of 1,000+ within 12 miles: a hill, a valley or the sea can make a real difference over a few miles.
| Town | July high | January low | Rain a year |
|---|---|---|---|
| Portsmouth | 23.1°C | 2.8°C | 774 mm |
| Gosport 3.3 mi | 23.0°C about the same | 3.2°C about the same | 795 mm |
| Stoke 4.3 mi | 23.0°C about the same | 2.7°C about the same | 728 mm |
| Waterlooville 4.7 mi | 22.7°C about the same | 2.3°C 0.5°C colder | 853 mm |
| South Hayling 5.0 mi | 22.2°C 0.9°C cooler | 3.1°C about the same | 739 mm |
| Havant 5.3 mi | 23.0°C about the same | 2.5°C about the same | 766 mm |
| Fareham 5.8 mi | 23.0°C about the same | 2.9°C about the same | 790 mm |
Portsmouth weather by month
Average daily high and low, mean temperature and rain, 1991–2020, for the town itself (the Met Office’s HadUK-Grid).
| Month | High | Low | Mean | Rain |
|---|---|---|---|---|
| January | 9.0°C 48°F | 2.8°C 37°F | 5.9°C | 86 mm 3.4 in |
| February | 9.4°C 49°F | 2.7°C 37°F | 6.0°C | 60 mm 2.4 in |
| March | 11.8°C 53°F | 4.0°C 39°F | 7.8°C | 50 mm 2.0 in |
| April | 14.8°C 59°F | 5.6°C 42°F | 10.2°C | 53 mm 2.1 in |
| May | 18.1°C 65°F | 8.5°C 47°F | 13.3°C | 43 mm 1.7 in |
| June | 21.0°C 70°F | 11.3°C 52°F | 16.1°C | 50 mm 2.0 in |
| July | 23.1°C 74°F | 13.4°C 56°F | 18.2°C | 46 mm 1.8 in |
| August | 23.0°C 73°F | 13.4°C 56°F | 18.2°C | 60 mm 2.3 in |
| September | 20.4°C 69°F | 11.3°C 52°F | 15.8°C | 58 mm 2.3 in |
| October | 16.4°C 62°F | 8.8°C 48°F | 12.6°C | 88 mm 3.5 in |
| November | 12.4°C 54°F | 5.7°C 42°F | 9.1°C | 90 mm 3.6 in |
| December | 9.7°C 49°F | 3.5°C 38°F | 6.6°C | 89 mm 3.5 in |
| Year | 15.8°C | 7.6°C | 11.7°C | 774 mm |
Where Portsmouth’s numbers come from
Averages over 30 years, not a forecast.
- Mean temperature, rain and day counts: HadUK-Grid 1991–2020 averages for the 9 Met Office 2 km grid squares whose centre lies inside Portsmouth’s built-up area.
- Highs and lows: the Met Office publishes average daily maxima and minima on its 12 km grid; each is moved by the difference between the town’s 2 km mean temperature and the 12 km square’s, which carries the town’s own height and setting over.
- Weather station and sunshine: Met Office historic station data for Hurn, 33 miles away, months of 1991–2020 averaged.
- Comparisons: every town and city of 2,500 or more across the UK, all four nations, read the same way.
Met Office HadUK-Grid · Met Office Climate Data Portal · Historic station data. Open Government Licence v3.0.
Questions about Portsmouth’s climate
How warm does Portsmouth get in summer?
July is the warmest month, with average highs of 23.1°C (74°F). About 12 days a year reach 25°C (77°F), more than 57% of UK towns.
How cold does Portsmouth get in winter?
February nights average 2.7°C (37°F). The air drops below freezing on about 23 nights a year, and about under 1 days a year stay below freezing all day.
How much rain does Portsmouth get?
About 774 mm (30 in) a year, less than 50% of UK towns. November is the wettest month (90 mm) and May the driest (43 mm).
How sunny is it?
The nearest Met Office station with a sunshine record, Hurn (Bournemouth Airport) (33 miles away), averages 1,690 hours of bright sunshine a year. Sunshine isn’t on the town grid, so this is the station’s figure.
Where do these figures come from?
The Met Office’s HadUK-Grid 1991–2020 averages, which turn thousands of weather stations into a map of the UK in 2 km squares; the page reads the squares inside Portsmouth. They are 30-year averages, not a forecast.
Contains Met Office data © Crown copyright 2026, Open Government Licence v3.0. HadUK-Grid 1991–2020 averages via the Met Office Climate Data Portal; station averages from Met Office historic station data. Today’s forecast for Portsmouth →
Contains public sector information licensed under the Open Government Licence v3.0. Contains HM Land Registry data © Crown copyright and database right 2026. Contains OS data © Crown copyright and database right 2026 (ONS boundaries). Northern Ireland: Source: NISRA; contains Land & Property Services data and Ordnance Survey of Northern Ireland information, © Crown copyright, licensed under the Open Government Licence v3.0. Scotland: contains National Records of Scotland data, Registers of Scotland data and SEPA data, © Crown copyright / © SEPA 2025, licensed under the Open Government Licence v3.0.