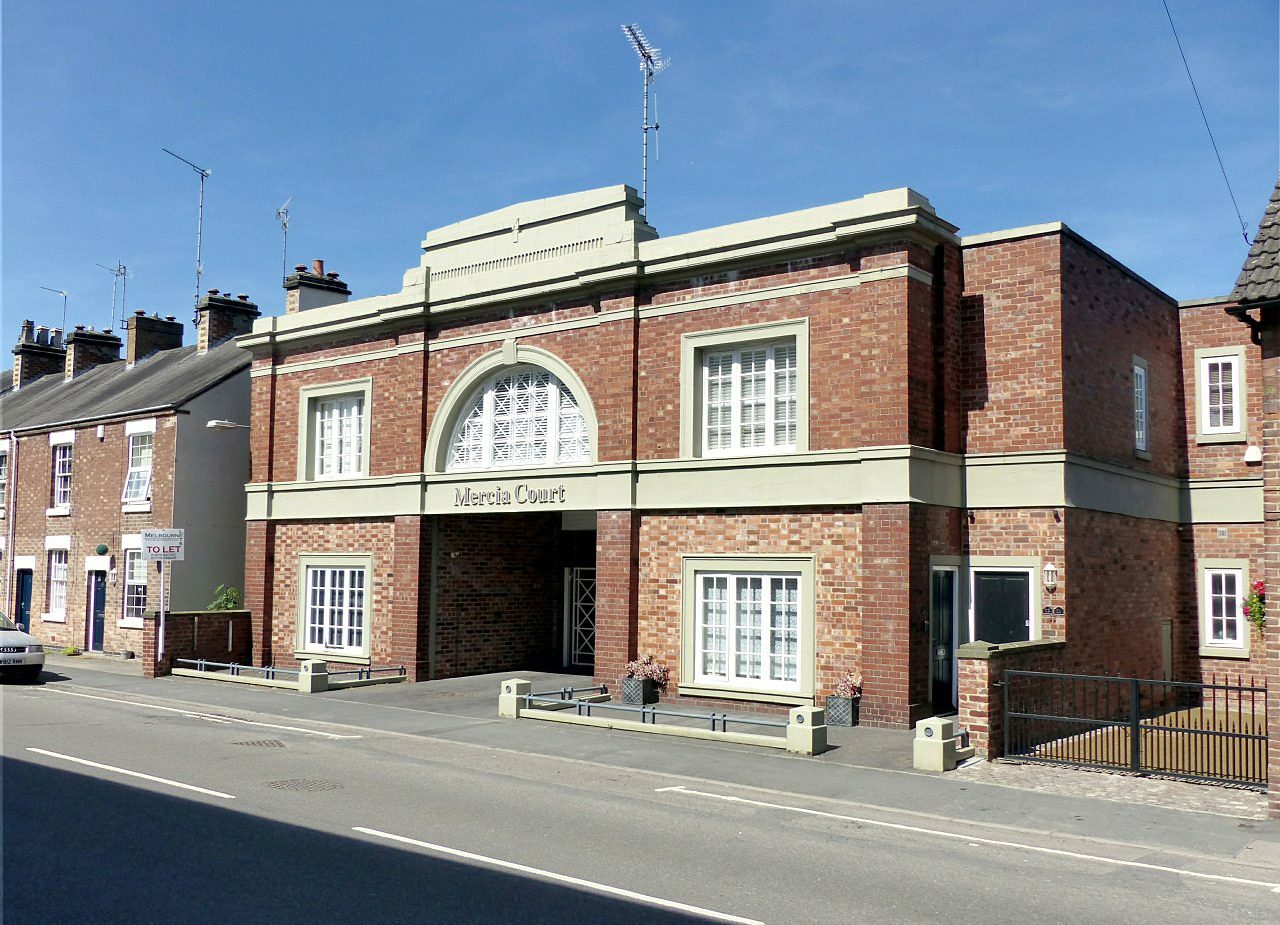
 Photo: Alan Murray-Rust · CC BY-SA 2.0
A higher share of residents aged 15 to 24 than 98% of UK towns, at 17%
51% of households live in a detached house; across England’s towns the figure is 21%. Repton is home to 2,766 residents in 1,010 households, by the 2021 Census. Households in terraced houses account for 13%. Compared with other places, unpaid carers are scarce here: 6.9%, fewer than in 97% of UK towns.
What the Census says about Repton’s people
A student town
The 2021 Census counted 301 full-time students aged 16 and over, 14% of adults, against 7.9% across England’s towns: more than in 98% of UK towns. That shows in the ages: 17% of residents are 15 to 24. Students & newcomers ↓
Written from the data on this page: ONS Census 2021 (output areas summed to the 2022 built-up area).
Repton is younger than 81% of UK towns: a median age of 39.9
Share of residents in each five-year age band, Census 2021.
Repton sits close to the norm on residents aged 65 and over: 18%, about the same as across England’s towns. In Bakewell, the oldest of Derbyshire’s towns by this measure, it is 38%.
Median age of UK towns of 2,500+
■ Repton, 39.9. The typical town is 44.4.
Broad ages · share of residents
Women and men · all residents
50% women, 50% men
About an even split. Across England, 51% of residents are women.
Full-time students make up 14% in Repton, more than in 98% of UK towns
What adults did at the 2021 Census (the ONS’s NS-SEC classes), and where residents lived a year earlier.
Adults by occupation class · residents 16 and over
Address a year before the Census
Residents who lived somewhere else a year earlier. The bar runs to 25%.
Leave the students aside and Repton’s other adults differ from England’s: 51% are in managerial and professional jobs, against 36%. As a yardstick, 7.9% of adults are full-time students across England’s towns. The census found that 13% of residents lived at another address a year earlier here.
The Census was taken on 21 March 2021, in term time, so students were counted at their term addresses.
26% of households are one person living alone, below 82% of UK towns
Household make-up at the 2021 Census. Each square is 1% of households.
Against Derbyshire’s towns and England’s towns
People per household
England’s towns.
Shared households of unrelated adults: 2.2% here and 4.3% across England’s towns. The wider picture: 30% of households are one person living alone across England’s towns. The census found that 31% of households have dependent children in Repton.
A smaller share of households without a car or van than 85% of UK towns: 9.4%
Accommodation type and cars or vans per household, Census 2021. Owning and renting are on Cost of living.
Type of home
Cars or vans · share of households
Compared with 23% across England’s towns, 6% of households live in a flat or apartment here. Against that, nearly a quarter of households have no car or van across England’s towns.
Repton ranks above 72% of UK towns on residents whose main language is English: 99%
Country of birth, year of arrival and main language, Census 2021.
Born outside the UK, by region · share of all residents; the bar runs to 25%
When those born abroad arrived
Main language · residents aged 3 and over
Since 2017: 23% of those born abroad, against 21% across England’s towns. On the census count, 5.2% of residents were born outside the UK. By way of comparison, nine in ten residents have English as their main language across England’s towns.
Repton sits above 67% of UK towns for residents who describe themselves as Christian (52%)
How residents described themselves at the 2021 Census. Lines join the lowest and highest of the three figures.
Ethnic groups other than White British · all residents
White British, not charted: 92% of Repton · Derbyshire’s towns 86% · England’s towns 73%.
Religion · all residents
Behind White British, the largest groups are Other White (2.4%), Mixed or multiple (1.9%) and Indian (1.2%). Measured more widely, 46% of residents describe themselves as Christian across England’s towns. In Repton, 92% of residents describe themselves as White British, beside 73% across England’s towns.
In Repton, 35% of adults have never married or formed a civil partnership, more than in 68% of UK towns
Legal partnership status (residents 16 and over) and unpaid care (residents 5 and over), Census 2021.
Partnership status · residents 16 and over
Unpaid care given · share of residents 5 and over
44% of adults are married or in a civil partnership across England’s towns, against 49% in Repton. Across England’s towns, adults who have never married come to 39%.
Degree-level qualifications: 44% of adults
Highest qualification, residents 16 and over, Census 2021.
Highest qualification · residents 16 and over
In Repton, 44% of adults hold a degree-level qualification, against 34% across England’s towns, while 10% have no qualification at all (18%). Students still working towards a degree help explain why A levels are the highest qualification of 16%.
514 UK towns of 2,500 to 4,000 people: this is the 55th youngest
Median age, Census 2021. Hover a dot for its students and residents born abroad; click for its page.
At the ends of the range sit Keele (20.6), the youngest, and West Chiltington (63.1), the oldest. Nearest to Repton in age: Teynham (39.7), Bethesda (39.8), Weldon (40) and Penllergaer (40.1).
Median age: 6 of the 7 towns around Repton are older
Nearby built-up areas coloured by median age, Census 2021. Tap a town for its page.
| Town | People | Away | Median age | 65+ | Homes with children |
|---|---|---|---|---|---|
| Repton | 2,766 | — | 39.9 | 18% | 31% |
| Willington | 2,717 | 1.1 mi | 46.5 | 23% | 27% |
| Findern | 1,608 | 2.5 mi | 52.2 | 31% | 22% |
| Stretton | 4,646 | 3.1 mi | 49.1 | 26% | 24% |
| Etwall | 3,080 | 3.6 mi | 44.2 | 23% | 31% |
| Rolleston on Dove | 2,902 | 4.2 mi | 52.7 | 31% | 22% |
| Hilton | 8,269 | 4.2 mi | 37.6 | 11% | 36% |
| Swadlincote | 34,569 | 4.2 mi | 41.7 | 18% | 28% |
Health, work and homes have their own pages
What this data can and can’t tell you
- The Census was taken in a lockdown, in term time. 21 March 2021 fell in term time, and students were asked to give their term-time address, so most were counted where they study. Some may have been living with family that day.
- “Derbyshire’s towns” and “England’s towns” mean their built-up areas. Census comparisons pool every built-up area in Derbyshire (or England), summed the same way as Repton’s figures, so households in open countryside are left out.
- Small counts are blurred. The ONS adds small random changes to Census counts to protect privacy, so the same total differs a little between tables, and the shares of a small town can move by a point or two.
Questions about Repton’s residents
What is the population of Repton?
The 2021 Census counted 2,766 people in Repton’s built-up area.
What is the average age in Repton?
The median age was 39.9 at the 2021 Census, younger than 81% of UK towns. 17% of residents were 15 to 24 and 18% were 65 or over.
Is Repton a student town?
Yes: 14% of adults were full-time students at the 2021 Census (301 people), against 7.9% across England’s towns.
How diverse is Repton?
92% of residents described themselves as White British in 2021, against 73% across England’s towns and 86% across Derbyshire’s towns. 5.2% were born outside the UK.
What religion are people in Repton?
41% said they had no religion and 52% that they were Christian at the 2021 Census; 0.4% were Muslim and 4.6% didn’t answer.
Is Repton good for families?
31% of households had dependent children in 2021, against 29% across England’s towns. Schools are on Repton’s schools page.
Sources: ONS Census 2021, output areas summed to the ONS 2022 built-up area (TS002, TS003, TS004, TS007A, TS008, TS015, TS017, TS019, TS021, TS029, TS030, TS039, TS044, TS045, TS062, TS067). All under the Open Government Licence v3.0.
Contains public sector information licensed under the Open Government Licence v3.0. Contains HM Land Registry data © Crown copyright and database right 2026. Contains OS data © Crown copyright and database right 2026 (ONS boundaries). Northern Ireland: Source: NISRA; contains Land & Property Services data and Ordnance Survey of Northern Ireland information, © Crown copyright, licensed under the Open Government Licence v3.0. Scotland: contains National Records of Scotland data, Registers of Scotland data and SEPA data, © Crown copyright / © SEPA 2025, licensed under the Open Government Licence v3.0.