Guest, Sign inJoin
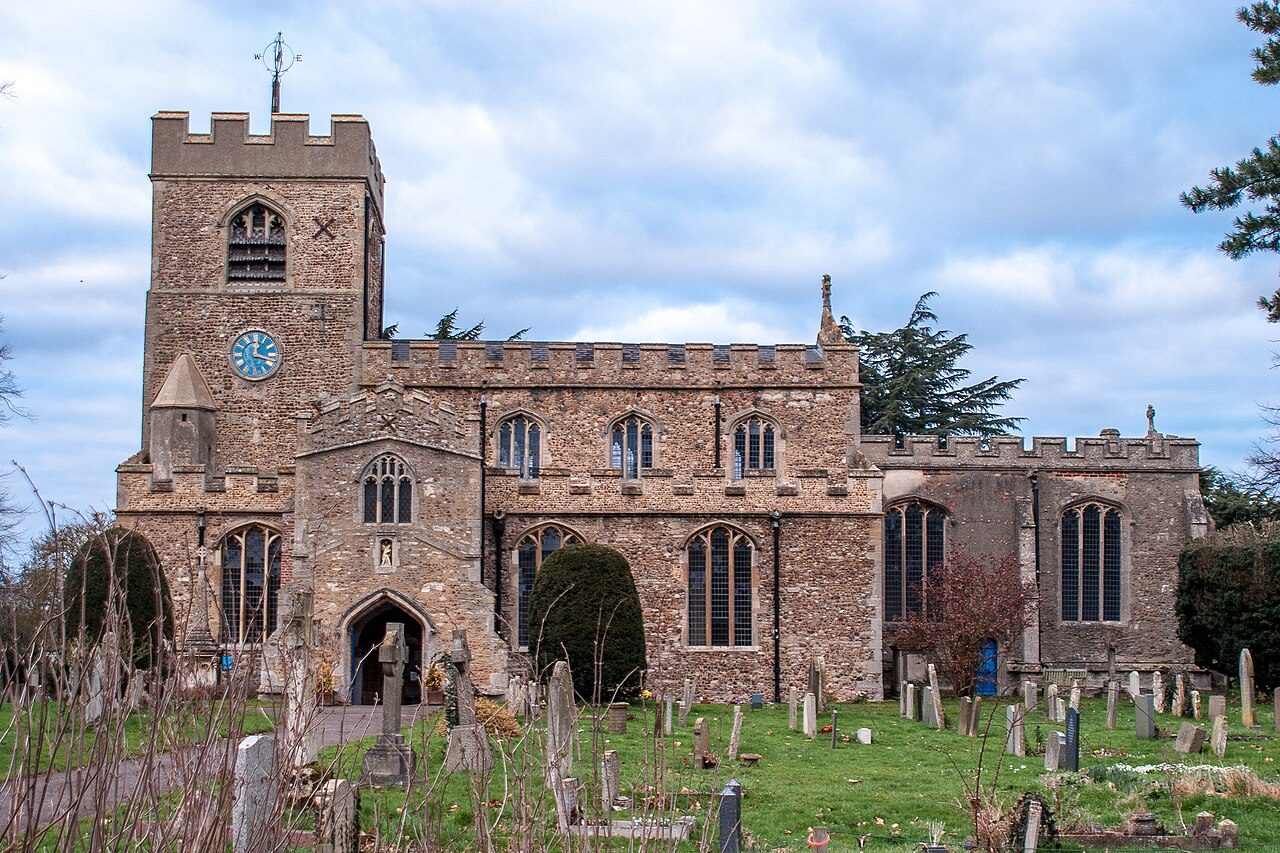
Doddington Chapel and clocktower (Cambridgeshire) - Geograph 2328868 b2a2e617Doddington and Wimblington, #1 on this list · Photo: Colin Smith · CC BY-SA 2.0
Cambridgeshire rankings · Climate

Towns with the warmest summers in Cambridgeshire

Doddington and Wimblington (tied with 1 more) has the warmest summers of Cambridgeshire’s 51 towns of 2,500+: July afternoons average a high of 23.5°C (Met Office, 1991–2020). The typical town here averages 23.0°C.

The average July high (the warmest month’s afternoons). Met Office HadUK-Grid 1991–2020 averages on its 2 km grid, the cells inside each town averaged (contains Met Office data © Crown copyright). A described list: no letters. The rank across England, Scotland, Wales and Northern Ireland sits beside each figure.

#T1
23.5°C

July high·24 days of 25°C+ a year·#35 of 2,537 in England, Scotland, Wales and Northern Ireland
#T1

March

21,345 people
23.5°C

July high·25 days of 25°C+ a year·#35 of 2,537 in England, Scotland, Wales and Northern Ireland

#T3

Girton

4,384 people
23.4°C

July high·22 days of 25°C+ a year·#45 of 2,537 in England, Scotland, Wales and Northern Ireland

All 51 towns, ranked

July high, highest first. Temperatures are ranked on two decimals and shown to one, so two towns showing the same figure can rank apart; towns smaller than a 2 km cell share its figures. Towns with the same figure share a rank (T = tied). Each rank across England, Scotland, Wales and Northern Ireland links to the national list.

Every town in Cambridgeshire →

51 towns.

#TownJuly highDays 25°C+UK rank
T1March21,345 people23.5°C25#35 of 2,537 nationally
T3Girton4,384 people23.4°C22#45 of 2,537 nationally
T3Milton4,150 people23.4°C23#45 of 2,537 nationally
5Cambridge152,742 people23.3°C24#63 of 2,537 nationally
7Fordham2,566 people23.2°C23#75 of 2,537 nationally
8Melbourn4,907 people23.2°C22#83 of 2,537 nationally
T9Cottenham6,156 people23.2°C22#89 of 2,537 nationally
T9Waterbeach5,375 people23.2°C22#89 of 2,537 nationally
11St Ives16,818 people23.1°C21#102 of 2,537 nationally
T12Peterborough190,592 people23.1°C23#107 of 2,537 nationally
14Yaxley9,403 people23.1°C22#121 of 2,537 nationally
15Bar Hill3,899 people23.1°C22#126 of 2,537 nationally
16Willingham3,912 people23.1°C22#131 of 2,537 nationally
T17Soham10,609 people23.1°C23#146 of 2,537 nationally
T17Whittlesey13,833 people23.1°C22#146 of 2,537 nationally
T20Fenstanton3,015 people23.0°C23#155 of 2,537 nationally
T20Swavesey2,739 people23.0°C23#155 of 2,537 nationally
T23St Neots33,262 people23.0°C20#166 of 2,537 nationally
T23Warboys4,318 people23.0°C19#166 of 2,537 nationally
26Eye5,419 people23.0°C22#177 of 2,537 nationally
27Manea2,638 people23.0°C23#187 of 2,537 nationally
T28Burwell5,912 people23.0°C22#201 of 2,537 nationally
T28Ely19,185 people23.0°C21#201 of 2,537 nationally
T28Hardwick2,658 people23.0°C20#201 of 2,537 nationally
T28Ramsey5,727 people23.0°C21#201 of 2,537 nationally
32Sawston7,270 people23.0°C22#210 of 2,537 nationally
33Somersham3,349 people23.0°C21#220 of 2,537 nationally
34Huntingdon25,603 people22.9°C20#234 of 2,537 nationally
T35Over2,898 people22.9°C22#251 of 2,537 nationally
T37Fulbourn3,737 people22.9°C23#271 of 2,537 nationally
T37Littleport9,170 people22.9°C21#271 of 2,537 nationally
39Linton4,452 people22.9°C18#293 of 2,537 nationally
40Wittering Garrison town2,678 people22.8°C15#297 of 2,537 nationally
41Wisbech26,800 people22.8°C20#313 of 2,537 nationally
T42Cambourne11,071 people22.8°C20#328 of 2,537 nationally
T42Chatteris11,022 people22.8°C21#328 of 2,537 nationally
T42Sawtry5,870 people22.8°C20#328 of 2,537 nationally
45Brampton6,585 people22.8°C20#337 of 2,537 nationally
48Sutton3,880 people22.8°C21#360 of 2,537 nationally
49Haddenham3,050 people22.7°C21#365 of 2,537 nationally
50Buckden2,757 people22.6°C19#445 of 2,537 nationally
51Gamlingay2,920 people22.6°C20#471 of 2,537 nationally
Quick answers

Questions people ask

Which town in Cambridgeshire has the warmest summers?

Doddington and Wimblington: July afternoons average a high of 23.5°C, with 24 days of 25°C or more in a typical year. March and Girton follow.

How are these towns ranked?

By the average July high, highest first, from the Met Office’s 1991–2020 averages on its 2 km grid: the cells inside the town, or the one nearest its centre for a town smaller than a cell. The figure is the one on each town’s Climate page.

Why isn’t my town on this list?

The list covers Cambridgeshire’s towns of 2,500+ with the figure. Smaller places show it on their own pages; every town in Cambridgeshire is on the county page.

Go deeper

More Cambridgeshire lists

Every list ranks the same 2,500+ towns, so a town’s rank means the same thing on each.

All Cambridgeshire rankings →
County by county

Towns with the warmest summers, county by county

Sources: . All under the Open Government Licence v3.0.

Contains public sector information licensed under the Open Government Licence v3.0. Contains HM Land Registry data © Crown copyright and database right 2026. Contains OS data © Crown copyright and database right 2026 (ONS boundaries). Northern Ireland: Source: NISRA; contains Land & Property Services data and Ordnance Survey of Northern Ireland information, © Crown copyright, licensed under the Open Government Licence v3.0. Scotland: contains National Records of Scotland data, Registers of Scotland data and SEPA data, © Crown copyright / © SEPA 2025, licensed under the Open Government Licence v3.0.