Guest, Sign inJoin
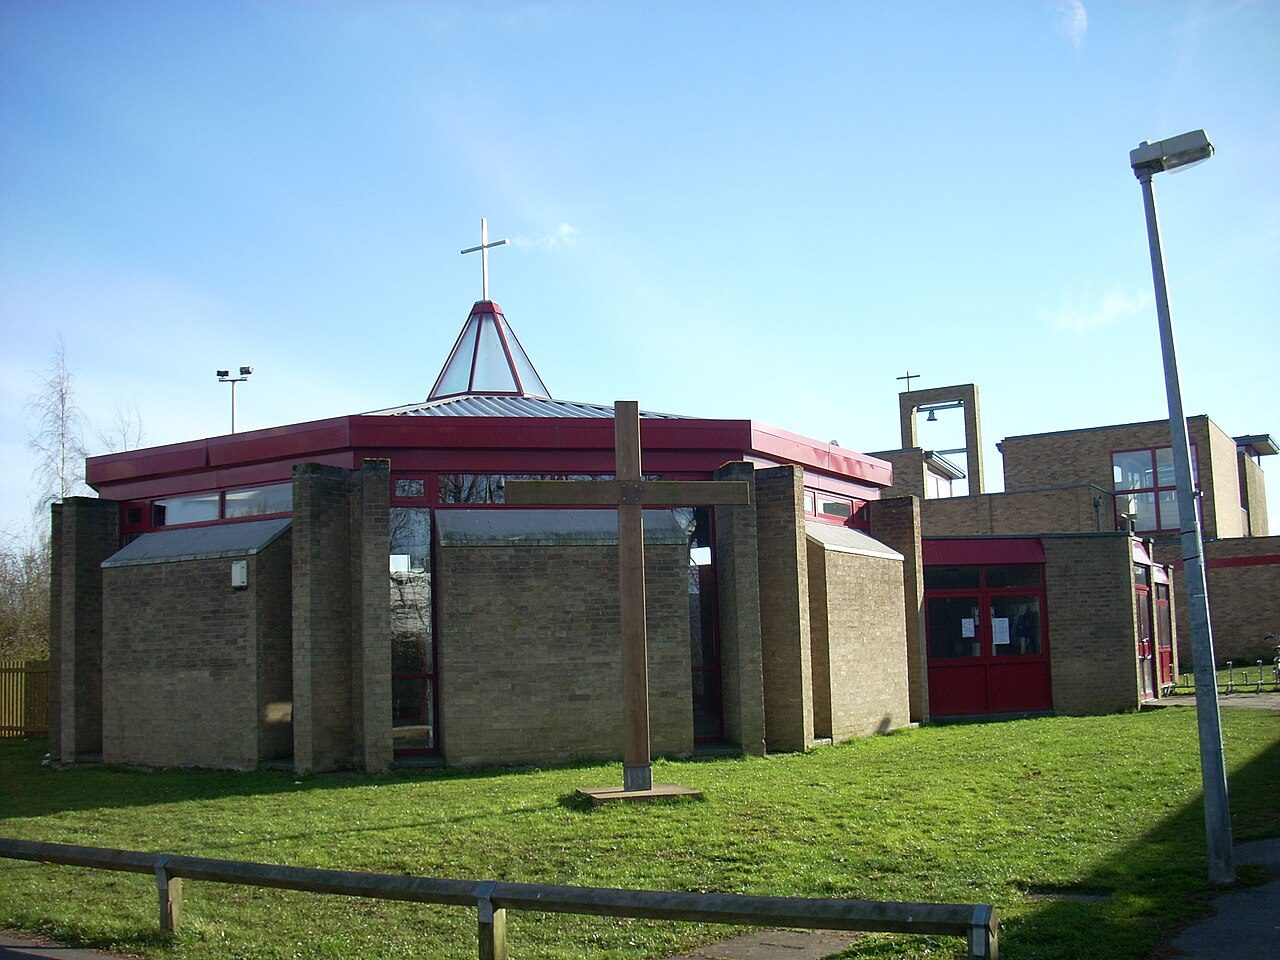
Bar Hill churchBar Hill, #1 on this list · Photo: Cruccone · CC BY 3.0
Cambridgeshire rankings · Climate

Driest towns in Cambridgeshire

Bar Hill is the driest of Cambridgeshire’s 51 towns of 2,500+: 540 mm of rain in a typical year (Met Office, 1991–2020). The typical town here gets 575 mm.

Rain in a typical year, in millimetres. Met Office HadUK-Grid 1991–2020 averages on its 2 km grid, the cells inside each town averaged (contains Met Office data © Crown copyright). A described list: no letters. The rank across England, Scotland, Wales and Northern Ireland sits beside each figure.

#1

Bar Hill

3,899 people
540mm

Rain a year·12 days of 10 mm+·#13 of 2,537 in England, Scotland, Wales and Northern Ireland

#2

Swavesey

2,739 people
546mm

Rain a year·10 days of 10 mm+·#18 of 2,537 in England, Scotland, Wales and Northern Ireland

#3

Fenstanton

3,015 people
548mm

Rain a year·11 days of 10 mm+·#22 of 2,537 in England, Scotland, Wales and Northern Ireland

All 51 towns, ranked

Rain a year, lowest first. Towns smaller than a 2 km cell share its figures. Towns with the same figure share a rank (T = tied). Each rank across England, Scotland, Wales and Northern Ireland links to the national list.

Every town in Cambridgeshire →

51 towns.

#TownRain a yearDays 10 mm+UK rank
1Bar Hill3,899 people540 mm12#13 of 2,537 nationally
2Swavesey2,739 people546 mm10#18 of 2,537 nationally
5Wittering Garrison town2,678 people553 mm11#27 of 2,537 nationally
7Melbourn4,907 people556 mm12#33 of 2,537 nationally
T9Burwell5,912 people562 mm11#43 of 2,537 nationally
T9Cottenham6,156 people562 mm12#43 of 2,537 nationally
T11Cambridge152,742 people563 mm12#46 of 2,537 nationally
T13Over2,898 people564 mm11#52 of 2,537 nationally
T13Willingham3,912 people564 mm11#52 of 2,537 nationally
16St Ives16,818 people565 mm11#56 of 2,537 nationally
17Brampton6,585 people566 mm12#59 of 2,537 nationally
T18Fulbourn3,737 people568 mm11#62 of 2,537 nationally
T18Milton4,150 people568 mm12#62 of 2,537 nationally
T18Soham10,609 people568 mm11#62 of 2,537 nationally
T21Girton4,384 people569 mm12#68 of 2,537 nationally
T21Somersham3,349 people569 mm11#68 of 2,537 nationally
23Buckden2,757 people572 mm12#73 of 2,537 nationally
24Haddenham3,050 people574 mm13#77 of 2,537 nationally
T25Chatteris11,022 people575 mm12#80 of 2,537 nationally
T25Ramsey5,727 people575 mm12#80 of 2,537 nationally
27Hardwick2,658 people576 mm13#86 of 2,537 nationally
28Whittlesey13,833 people577 mm12#90 of 2,537 nationally
T30Huntingdon25,603 people579 mm12#96 of 2,537 nationally
T30Linton4,452 people579 mm13#96 of 2,537 nationally
T30Manea2,638 people579 mm12#96 of 2,537 nationally
T30March21,345 people579 mm12#96 of 2,537 nationally
35Sawston7,270 people581 mm13#106 of 2,537 nationally
T36Cambourne11,071 people582 mm12#112 of 2,537 nationally
T36Ely19,185 people582 mm13#112 of 2,537 nationally
T36Sawtry5,870 people582 mm12#112 of 2,537 nationally
T36St Neots33,262 people582 mm11#112 of 2,537 nationally
41Fordham2,566 people583 mm11#121 of 2,537 nationally
43Eye5,419 people588 mm12#132 of 2,537 nationally
44Sutton3,880 people589 mm12#137 of 2,537 nationally
45Yaxley9,403 people592 mm12#149 of 2,537 nationally
46Wisbech26,800 people593 mm13#154 of 2,537 nationally
48Peterborough190,592 people598 mm13#169 of 2,537 nationally
50Gamlingay2,920 people601 mm12#187 of 2,537 nationally
51Warboys4,318 people604 mm12#196 of 2,537 nationally
Quick answers

Questions people ask

What is the driest town in Cambridgeshire?

Bar Hill: 540 mm of rain in a typical year, the most in October 56 mm. Swavesey and Fenstanton follow.

How are these towns ranked?

By the rain that falls in a typical year, least first, from the Met Office’s 1991–2020 averages on its 2 km grid: the cells inside the town, or the one nearest its centre for a town smaller than a cell. The figure is the one on each town’s Climate page.

Why isn’t my town on this list?

The list covers Cambridgeshire’s towns of 2,500+ with the figure. Smaller places show it on their own pages; every town in Cambridgeshire is on the county page.

Go deeper

More Cambridgeshire lists

Every list ranks the same 2,500+ towns, so a town’s rank means the same thing on each.

All Cambridgeshire rankings →
County by county

Driest towns, county by county

Sources: . All under the Open Government Licence v3.0.

Contains public sector information licensed under the Open Government Licence v3.0. Contains HM Land Registry data © Crown copyright and database right 2026. Contains OS data © Crown copyright and database right 2026 (ONS boundaries). Northern Ireland: Source: NISRA; contains Land & Property Services data and Ordnance Survey of Northern Ireland information, © Crown copyright, licensed under the Open Government Licence v3.0. Scotland: contains National Records of Scotland data, Registers of Scotland data and SEPA data, © Crown copyright / © SEPA 2025, licensed under the Open Government Licence v3.0.