 #1
Honeybourne
3,104 peopleRain a year·13 days of 10 mm+·#247 of 2,537 in England, Scotland, Wales and Northern Ireland
Each edition grades its towns against each other only.
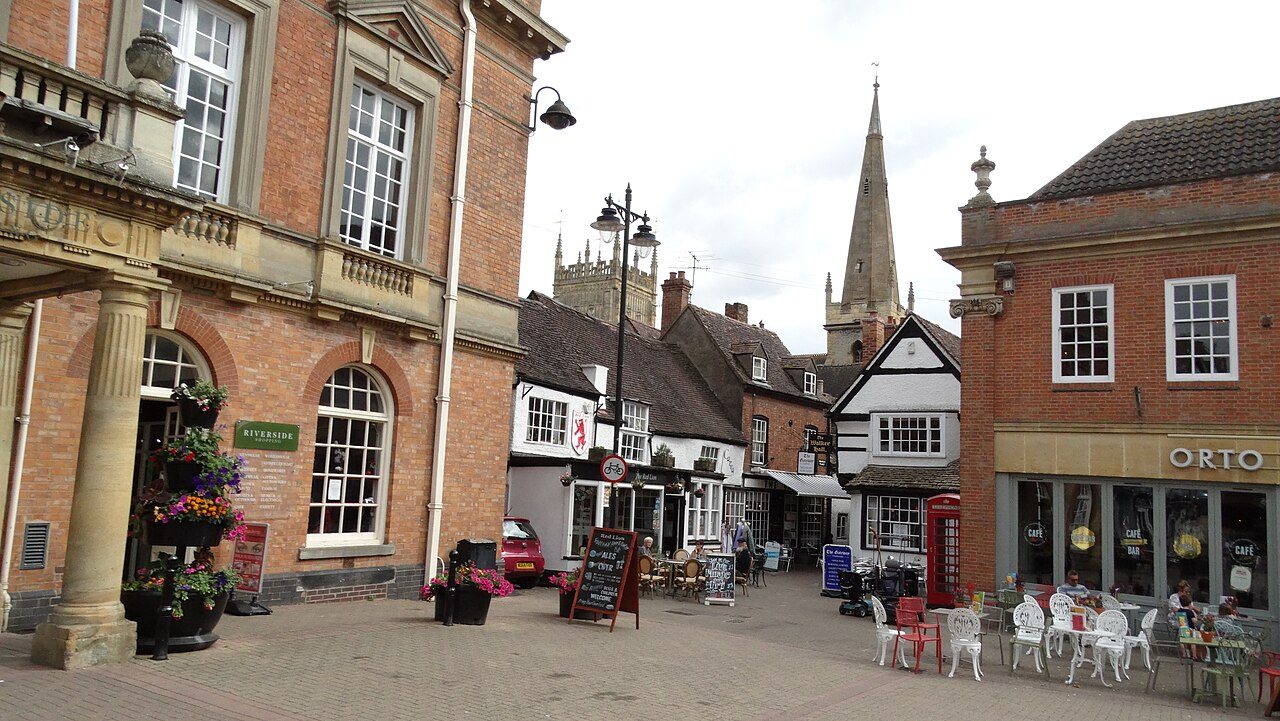
Honeybourne, #1 on this list · Photo: Dave Bushell · CC BY-SA 2.0Honeybourne is the driest of Worcestershire’s 22 towns of 2,500+: 613 mm of rain in a typical year (Met Office, 1991–2020). The typical town here gets 710 mm.
Rain in a typical year, in millimetres. Met Office HadUK-Grid 1991–2020 averages on its 2 km grid, the cells inside each town averaged (contains Met Office data © Crown copyright). A described list: no letters. The rank across England, Scotland, Wales and Northern Ireland sits beside each figure.
#1Rain a year·13 days of 10 mm+·#247 of 2,537 in England, Scotland, Wales and Northern Ireland
 #2
Rain a year·14 days of 10 mm+·#477 of 2,537 in England, Scotland, Wales and Northern Ireland
 #T3
Rain a year·14 days of 10 mm+·#596 of 2,537 in England, Scotland, Wales and Northern Ireland
Rain a year, lowest first. Towns smaller than a 2 km cell share its figures. Towns with the same figure share a rank (T = tied). Each rank across England, Scotland, Wales and Northern Ireland links to the national list.
22 towns.
Honeybourne: 613 mm of rain in a typical year, the most in November 59 mm. Badsey and Evesham follow.
By the rain that falls in a typical year, least first, from the Met Office’s 1991–2020 averages on its 2 km grid: the cells inside the town, or the one nearest its centre for a town smaller than a cell. The figure is the one on each town’s Climate page.
The list covers Worcestershire’s towns of 2,500+ with the figure. Smaller places show it on their own pages; every town in Worcestershire is on the county page.
Every list ranks the same 2,500+ towns, so a town’s rank means the same thing on each.
Sources: . All under the Open Government Licence v3.0.
Contains public sector information licensed under the Open Government Licence v3.0. Contains HM Land Registry data © Crown copyright and database right 2026. Contains OS data © Crown copyright and database right 2026 (ONS boundaries). Northern Ireland: Source: NISRA; contains Land & Property Services data and Ordnance Survey of Northern Ireland information, © Crown copyright, licensed under the Open Government Licence v3.0. Scotland: contains National Records of Scotland data, Registers of Scotland data and SEPA data, © Crown copyright / © SEPA 2025, licensed under the Open Government Licence v3.0.