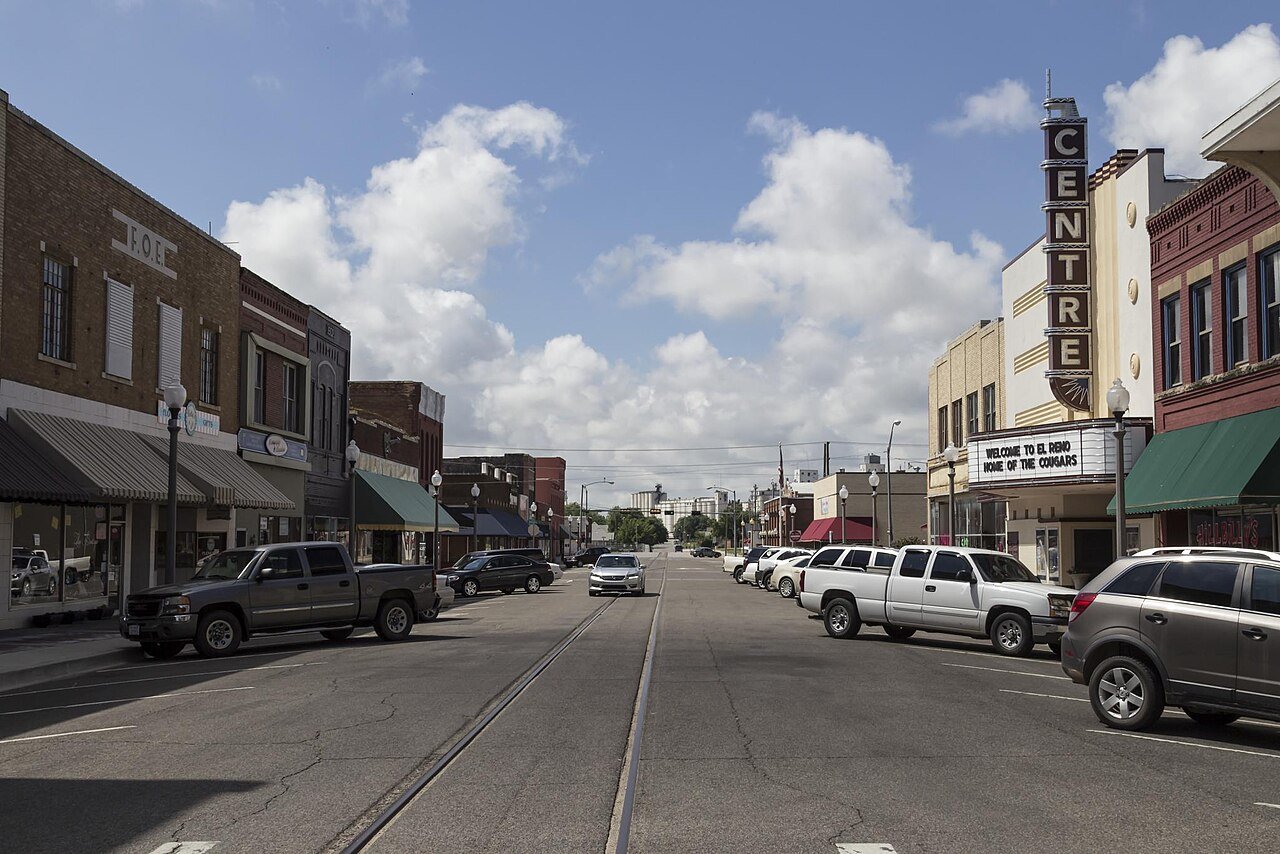
 Photo: Larry D. Moore · CC BY 4.0
Work means Oklahoma City for about two in five of Union City’s working residents
For jobs and income Union City is better than 69% of U.S. towns (B+); for walkability it is more walkable than 29% of U.S. towns (C). Household incomes here are higher than in 81% of U.S. towns. Only 3% work in Union City; the top destination outside it is Oklahoma City (40%, 23 miles).
Census ACS 2020–24, Census LEHD 2023, EPA Smart Location Database. How the two grades are made
The work figures that set Union City apart
Union City makes and builds things
62% of the jobs based in Union City are in goods: factories, construction and farms. Across the jobs Union City residents hold, wherever they work, it’s 19%. The jobs ↓
The jobs in Union City pay better than its residents’ jobs
74% of the jobs based in Union City pay over $3,333 a month (about $40,000 a year), against 56% of the jobs Union City residents hold. 96% of the jobs here are held by people who live outside Union City. The jobs ↓
Written from the Census figures on this page. Commute flows, distances and jobs are Census LEHD 2023, primary jobs only (the self-employed aren’t counted); commute time and working from home are from the Census American Community Survey; with 634 working residents, small shifts move the shares.
What drives the Jobs & income grade in Union City
Household income holds Union City’s grade up ($105,833, U.S. $80,734); the poverty rate pulls it down (11.5%, U.S. 12.5%). It also does well on job access by car.
Unemployment (2.9%) is left out: Union City’s labor force is under 1,000, too few workers for a steady figure.
A fairly firm grade. Within the Census margins of error for income and poverty, Union City could be anywhere from B to A.
The places Union City commutes to
Where Union City clocks in
 40% of workers
 17% of workers
 3% of workers
Lines run between town centers. The top 10 towns each way; “Everywhere else” is the rest, including other states.
A thicker line means more commuters. Switch between where residents work and where the people who work here live.
Making and building: 62% of jobs based in Union City
493 jobs are based in Union City.
What kind of work
What it pays
Who does it
Jobs based in Union City, 2013 → 2023: 202 → 493. Big swings can come from how a large employer reports its locations, not only from real openings or closings.
Primary jobs covered by unemployment insurance (not the self-employed). Pay is monthly earnings. LEHD 2023.
Here is what they are, next to the jobs Union City’s own residents hold wherever they work.
A workday in Union City: who goes, who stays, who comes
On a workday 612 residents head out to work, 22 work right here, and 471 people come in from elsewhere.
About as many people by day as by night: the people who leave are replaced by the people who come in.
About as many jobs as working residents (0.78 per resident).
Workday population = residents − those who work elsewhere + those who come in (the Census “commuter-adjusted” method). Residents: Census survey; commuters: LEHD 2023, primary jobs.
About 27 minutes each way, longer than most of Oklahoma
Round trip, about 230 workdays a year: roughly 8.7 full days in the car, bus or train.
Average commute minutes, one way
of Union City workers work from home, vs 9% across Oklahoma. Their commute is the hallway.
Share of the 676 commuters (the 11% who work from home are left out). Across Oklahoma: 85% drive alone, <1% take transit; U.S.: 81% and 4%. Census ACS 2020–24.
From the Census survey of workers who don’t work from home.
How far it is to work from Union City
About 15% show a job over 50 miles away. Some of that is real, and some is employers that report every worker at a head office, so a few long commutes are on paper only.
Straight-line distance from each worker’s home block to their main job’s block. LEHD 2023.
Every working resident’s trip, home to work, as the crow flies. Roads add to it, so real drives run longer.
In Union City, most people drive to work
How people get to work scores higher than the street layout: 2.7% of commuters walk, bike or take transit, against 2.5% across Oklahoma, on an EPA index of 4.4.
A firm grade. EPA’s index has no published margin of error; the commuting share comes from a Census survey of 758 workers.
How TownRatings grades walkability →
Transit service: no data. EPA’s transit file has no stops for most of this county (its agencies had not published schedules in the format EPA used in 2020). That is missing data, not a finding that there is no bus or train.
Households without a car (shown, not graded). 1.2% of Union City households have no vehicle (Oklahoma 5.6%, U.S. 8.4%). 0% of Union City’s commuters take a bus or train.
Ranked on jobs and income, Union City is 1,262nd among 5,404 U.S. towns of 1,500 to 2,900
| # | Town | People | Household income | Poverty | Unemployment | Work in town | Grade |
|---|---|---|---|---|---|---|---|
| 1 | Kenilworth IL | 2,437 | $250K | 2.1% | 4.0% | 2% | A+ |
| 2 | Chevy Chase Village MD | 1,978 | $250K | 1.2% | 2.6% | 3% | A+ |
| 3 | Belle Meade TN | 2,621 | $250K | 1.4% | 0.3% | 2% | A+ |
| … | |||||||
| 970 | Justice OK | 1,530 | $98K | 7.5% | 2.7% | 1% | B+ |
| … | |||||||
| 1,260 | Miami Township OH | 2,130 | $74K | 4.6% | 2.2% | 3% | B+ |
| 1,261 | Kiefer OK | 2,310 | $83K | 10.4% | 3.0% | 1% | B+ |
| 1,262 | Union City OK | 2,129 | $106K | 11.5% | 2.9% | 3% | B+ |
| 1,263 | Lomira WI | 2,686 | $70K | 8.9% | 1.9% | 9% | B+ |
| 1,264 | Lynden Township MN | 1,871 | $112K | 9.5% | 3.9% | 2% | B+ |
| … | |||||||
| 2,361 | Norwood OK | 1,752 | $89K | 8.2% | 0.0% | <1% | B− |
| … | |||||||
| 2,435 | Nicoma Park OK | 2,294 | $62K | 17.8% | 3.5% | 2% | B− |
| … | |||||||
| 5,404 | Lame Deer MT | 1,872 | $24K | 55.8% | 42.2% | 60% | D− |
Census ACS 2020–24 (income, poverty, unemployment), Census LEHD (work in town), TownRatings Jobs & income grades. Each town links to its Work & commute page.
Ranked on the Jobs & income grade: the towns either side of Union City, the top three, the last and three more from Oklahoma.
Work next door: 41% of Union City’s workers
Average commute minutes, one way
Jobs & commute next door
| Town | Union City workers there | Jobs & income | Walkability | Commute | Household income |
|---|---|---|---|---|---|
| Union City | – | B+ | C | 27 min | $105,833 |
| Minco | 1% | C+ | B− | 24 min | $61,000 |
| Oklahoma City | 40% | B− | B+ | 22 min | $68,656 |
Same-state neighbors only. Commute: average minutes each way, Census ACS 2020–24.
The biggest share goes to Oklahoma City. Darker towns draw more of Union City’s workers. Tap a town to see its commute.
What this data can and can’t tell you
- Two sources, two years. Trips, distances and jobs based here: Census LEHD 2023, primary jobs, where the employer reports them. Income, poverty, unemployment, commute time and how people travel: Census ACS 2020–24 averages.
- Straight lines, older transit. Miles are as the crow flies. EPA’s walkability and transit files use 2017–20 inputs.
Jobs and commuting in Union City: questions
What is the median household income in Union City?
$105,833 (±$7,305) (Census ACS 2020–24), against $65,039 across Oklahoma and $80,734 nationally.
What is the poverty rate in Union City?
11.5%, against 15.3% across Oklahoma and 12.5% nationally (Census ACS 2020–24).
How long is the commute from Union City?
27 minutes each way on average, against 22 across Oklahoma and 26 nationally. 11% of workers work from home.
Where do people who live in Union City work?
3% work in town.
Is Union City walkable?
Union City is more walkable than 29% of U.S. towns (Walkability C): an EPA walkability index of 4.4 out of 20, and 3% of commuters walk, bike or take transit.
Can you get around Union City without a car?
0% of commuters take transit and 1% of households have no car. EPA has no transit data for this county.
Commuter talk
Getting to work from Union City, from the people who make the trip.
More of Union City
Flows, distances and jobs: U.S. Census Bureau, LEHD Origin-Destination Employment Statistics (LODES 8), 2023, primary jobs. Commute time, working from home and working out of state: U.S. Census Bureau, American Community Survey 5-year estimates. Distances are straight lines between home and work; real drives run longer. Walkability index, job access and transit service: U.S. EPA Smart Location Database. The two grades are our own summaries of these figures, not official ratings.