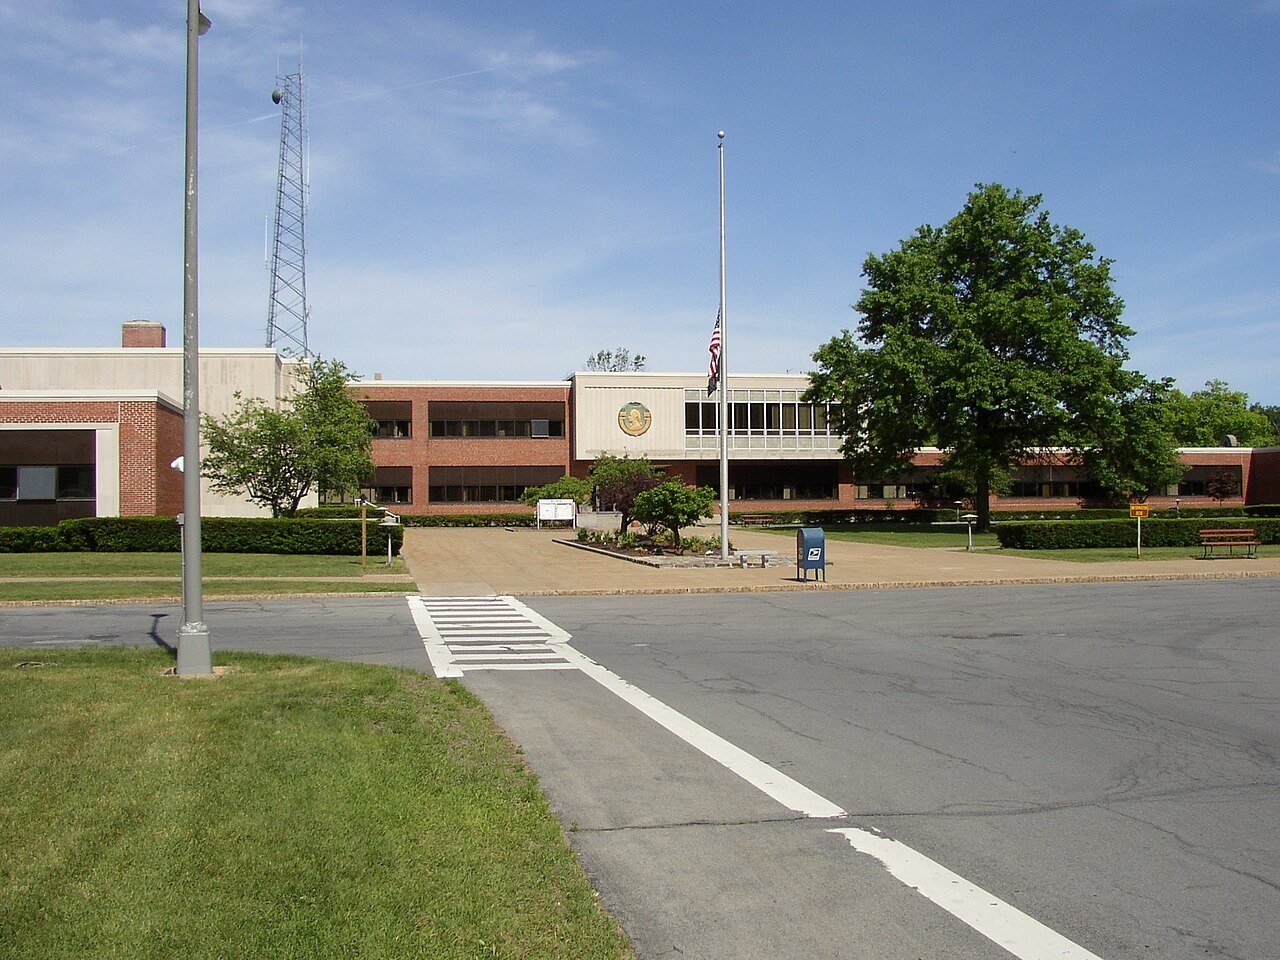
 Photo: Ser Amantio di Nicolao · CC BY-SA 3.0
At 5.8%, unemployment in Fort Edward is higher than in 72% of U.S. towns
Only 4% stay in Fort Edward for work; outside it, Glens Falls is the main destination (16%, 4 miles). Fort Edward grades C for jobs and income and C for walkability. The trip to work takes 23 minutes on average, against 33 across New York and 26 nationally.
Census ACS 2020–24, Census LEHD 2024, EPA Smart Location Database. How the two grades are made
Where Fort Edward stands out on work
Commutes from Fort Edward are quick
The average trip to work takes 23 minutes, against 33 across New York. That’s about 77 hours a year less on the road than the typical New York worker. Time on the road ↓
Fort Edward makes and builds things
46% of the jobs based in Fort Edward are in goods: factories, construction and farms. Across the jobs Fort Edward residents hold, wherever they work, it’s 22%. The jobs ↓
Most jobs in Fort Edward pay over $40,000 a year
75% of the jobs based in Fort Edward pay over $3,333 a month (about $40,000 a year), the top earnings band in the Census data. The jobs ↓
Written from the Census figures on this page. Commute flows, distances and jobs are Census LEHD 2024, primary jobs only (the self-employed aren’t counted); commute time and working from home are from the Census American Community Survey.
How Fort Edward earns its Jobs & income grade
On income, poverty, unemployment and job access, Fort Edward is better than 32% of U.S. towns, #565 of 758 in New York. Job access by car holds Fort Edward’s grade up (ahead of 45% of U.S. towns); unemployment pulls it down.
A rough placement. Within the Census margins of error for income, poverty and unemployment, Fort Edward could be anywhere from D to B+.
About 23 minutes each way, quicker than most of New York
Round trip, about 230 workdays a year: roughly 7.3 full days in the car, bus or train.
Average commute minutes, one way
of Fort Edward workers work from home, vs 15% across New York. Their commute is the hallway.
Share of the 1,375 commuters (the 9% who work from home are left out). Across New York: 57% drive alone, 25% take transit; U.S.: 81% and 4%. Census ACS 2020–24.
From the Census survey of workers who don’t work from home.
Goods, not services: 46% of the jobs in Fort Edward
875 jobs are based in Fort Edward.
What kind of work
What it pays
Who does it
Jobs based in Fort Edward, 2014 → 2024: 952 → 875. Big swings can come from how a large employer reports its locations, not only from real openings or closings.
Primary jobs covered by unemployment insurance (not the self-employed). Pay is monthly earnings. LEHD 2024.
Here is what they are, next to the jobs Fort Edward’s own residents hold wherever they work.
Who leaves Fort Edward for work, and who comes in
On a workday 1,372 residents head out to work, 60 work right here, and 815 people come in from elsewhere.
About 2,600 people are in Fort Edward on a workday afternoon, 18% fewer than live here.
0.61 jobs for every working resident, so most people commute out.
Workday population = residents − those who work elsewhere + those who come in (the Census “commuter-adjusted” method). Residents: Census survey; commuters: LEHD 2024, primary jobs.
Where people from Fort Edward work
Where Fort Edward clocks in
 16% of workers
 12% of workers
 10% of workers
Lines run between town centers. The top 10 towns each way; “Everywhere else” is the rest, including other states.
A thicker line means more commuters. Switch between where residents work and where the people who work here live.
How many miles Fort Edward commutes
Straight-line distance from each worker’s home block to their main job’s block. LEHD 2024.
Every working resident’s trip, home to work, as the crow flies. Roads add to it, so real drives run longer.
For most of Fort Edward, work means a drive
On EPA’s walkability index and the share of commuters who walk, bike or take transit, Fort Edward is more walkable than 26% of U.S. towns, #665 of 758 in New York. The street layout scores higher than the way people actually get to work: hardly any commuters walk, bike or take transit, below the 32.9% across New York.
A firm grade. EPA’s index has no published margin of error; the commuting share comes from a Census survey of 1,512 workers.
How TownRatings grades walkability →
Transit service: no data. EPA’s transit file has no stops for most of this county (its agencies had not published schedules in the format EPA used in 2020). That is missing data, not a finding that there is no bus or train.
Households without a car (shown, not graded). 12.4% of Fort Edward households have no vehicle (New York 29.2%, U.S. 8.4%). 0% of Fort Edward’s commuters take a bus or train.
3,092nd of 4,562: where Fort Edward ranks among U.S. towns of 2,200 to 4,200
| # | Town | People | Household income | Poverty | Unemployment | Work in town | Grade |
|---|---|---|---|---|---|---|---|
| 1 | Kenilworth IL | 2,437 | $250K | 2.1% | 4.0% | 2% | A+ |
| 2 | Riverwoods IL | 3,766 | $249K | 0.7% | 0.7% | 3% | A+ |
| 3 | Belle Meade TN | 2,621 | $250K | 1.4% | 0.3% | 2% | A+ |
| … | |||||||
| 8 | East Williston NY | 2,616 | $215K | 2.3% | 1.7% | 2% | A+ |
| 9 | Lloyd Harbor NY | 3,587 | $250K | 2.1% | 0.9% | 2% | A+ |
| … | |||||||
| 45 | Great Neck Estates NY | 3,139 | $238K | 5.7% | 1.7% | 3% | A+ |
| … | |||||||
| 3,090 | Olivia MN | 2,288 | $63K | 13.3% | 3.1% | 29% | C |
| 3,091 | Granite Falls MN | 2,691 | $59K | 7.7% | 4.7% | 30% | C |
| 3,092 | Fort Edward NY | 3,128 | $72K | 13.6% | 5.8% | 4% | C |
| 3,093 | Adams Township MI | 2,330 | $58K | 7.4% | 4.7% | 3% | C |
| 3,094 | Cornplanter Township PA | 2,258 | $69K | 16.6% | 2.9% | 5% | C |
| … | |||||||
| 4,562 | Lake Isabella CA | 4,059 | $27K | 40.7% | 8.6% | 19% | D− |
Census ACS 2020–24 (income, poverty, unemployment), Census LEHD (work in town), TownRatings Jobs & income grades. Each town links to its Work & commute page.
Ranked on the Jobs & income grade: the towns either side of Fort Edward, the top three, the last and three more from New York.
The towns around Fort Edward
Jobs & commute next door
| Town | Fort Edward workers there | Jobs & income | Walkability | Commute | Household income |
|---|---|---|---|---|---|
| Fort Edward | – | C | C | 23 min | $71,845 |
| Moreau | 4% | B− | C | 22 min | $81,317 |
Same-state neighbors only. Commute: average minutes each way, Census ACS 2020–24.
The biggest share goes to Moreau. Darker towns draw more of Fort Edward’s workers. Tap a town to see its commute.
What this data can and can’t tell you
- Two sources, two years. Trips, distances and jobs based here: Census LEHD 2024, primary jobs, where the employer reports them. Income, poverty, unemployment, commute time and how people travel: Census ACS 2020–24 averages.
- Straight lines, older transit. Miles are as the crow flies. EPA’s walkability and transit files use 2017–20 inputs.
Jobs and commuting in Fort Edward: questions
What is the median household income in Fort Edward?
$71,845 (±$20,042) (Census ACS 2020–24), against $85,974 across New York and $80,734 nationally.
What is the poverty rate in Fort Edward?
13.6%, against 14.0% across New York and 12.5% nationally (Census ACS 2020–24).
How long is the commute from Fort Edward?
23 minutes each way on average, against 33 across New York and 26 nationally. 9% of workers work from home.
Where do people who live in Fort Edward work?
4% work in town. The top destinations elsewhere are Glens Falls (16%, 4 mi), Queensbury (12%, 8 mi), Fort Edward (10%, 3 mi) (Census LEHD 2024).
Is Fort Edward walkable?
Fort Edward is more walkable than 26% of U.S. towns (Walkability C): an EPA walkability index of 7.3 out of 20, and 0% of commuters walk, bike or take transit.
Can you get around Fort Edward without a car?
0% of commuters take transit and 12% of households have no car. EPA has no transit data for this county.
Commuter talk
Getting to work from Fort Edward, from the people who make the trip.
More of Fort Edward
Flows, distances and jobs: U.S. Census Bureau, LEHD Origin-Destination Employment Statistics (LODES 8), 2024, primary jobs. Commute time, working from home and working out of state: U.S. Census Bureau, American Community Survey 5-year estimates. Distances are straight lines between home and work; real drives run longer. Walkability index, job access and transit service: U.S. EPA Smart Location Database. The two grades are our own summaries of these figures, not official ratings.