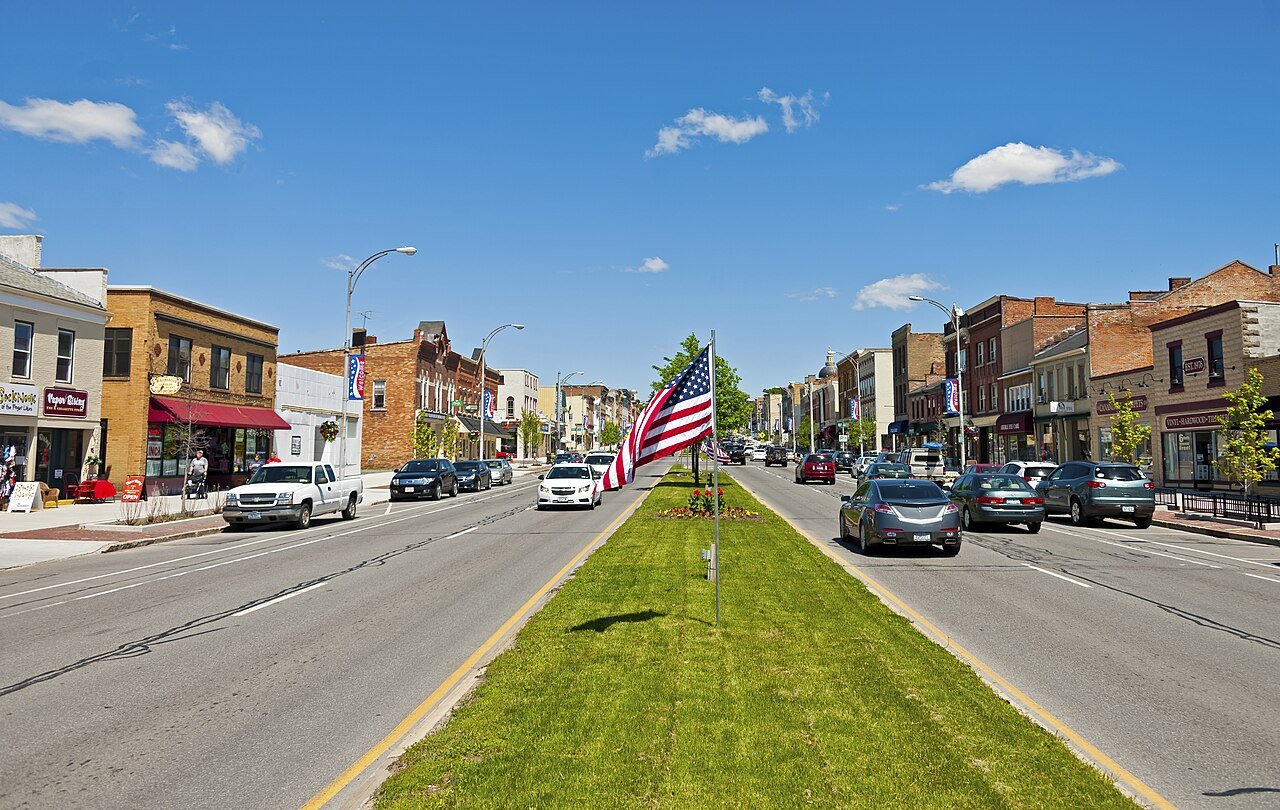
 Photo: Daniel Case · CC BY-SA 3.0
How is Canandaigua run?
Canandaigua’s town government spent $6.7 million on day-to-day services in the year to December 31, 2022, about $586 per resident. Water and other utilities ($1.2 million) are counted separately.
What stands out about how Canandaigua is run
Read from the town’s budget and official records.
Canandaigua City School District
Canandaigua’s K–12 school district, shared with Canandaigua, Hopewell. It’s its own government, with a budget separate from the town’s.
Of the $24,052 per pupil, $15,810 goes to the classroom (teachers, aides, supplies); the rest to buses, buildings, counselors and administration. Building projects and debt payments aren’t in the per-pupil figure.
New York districts overall: 51% local, 41% state, 8% federal.
East Bloomfield Central School District · $26,908 per pupil
School year 2023–24. Census Bureau school finance survey.
About $586 per resident a year, or $1.61 a day
Day-to-day services only. The biggest line: roads & transportation, at 34%.
Thank you for being a neighbor
$586 per resident in 2022, close to the middle of similar towns
Canandaigua’s day-to-day spending in 2022 ($586 per resident, hospital and utilities left out) against 83 New York towns and townships of 10,000–24,999 that don’t run their own schools: the median was $543, and the middle half spent $373–$826. Canandaigua spent more than 55% of them.
Includes sewer and trash ($192,000), as the Census Bureau counts them. Later years come from a Census sample, so the comparison stays on 2022. How Town Hall compares budgets →
New York towns and townships of 10,000–24,999 that don’t run their own schools, 2022 Census of Governments (every government counted that year; Canandaigua itself left out).
No trend yet
Canandaigua reported only 2022 to the Census Bureau, so there is no trend yet.
full-time in March 2025, up from 36 in 2022.
The typical homeowner pays $6,718 a year
Every local property tax on the home: town, schools and county. About 1.94% of the home’s value, vs 1.55% across New York.
Typical yearly bill next door and statewide
The Housing page’s calculator splits a monthly payment into loan, tax and insurance at Canandaigua’s rate.
Can I afford it? →The median bill homeowners report to the Census survey (bills of $10,000+ are reported as “$10,000+”). The effective rate is that bill ÷ the median home value: a rough guide, not the official tax rate.
Tax bills are one input to Canandaigua’s Cost of living grade. Cost of living in Canandaigua →
Who’s in charge in Canandaigua
Names change after every election, so we link to the source that keeps them current.
Canandaigua’s meeting calendar isn’t in our feed yet. The town posts agendas and minutes on canandaigua.govoffice.com ↗.
One full-time town employee for every 271 residents
On the payroll in March 2025, from the Census Bureau’s Annual Survey of Public Employment & Payroll. Residents: the Census population in the 2022 finance file (11,373).
By department full-time, plus part-time, March 2025
The Census reports one month’s payroll (March); yearly figures are that month × 12, an estimate. Part-timers count half in the bar lengths.
Canandaigua’s votes are counted by county
New York reports official results by county and precinct, not by town, so there are no official results for Canandaigua alone, and we don’t estimate them. These are Ontario County’s results.
 Donald J TrumpRepublican50.1%30,221 votes
 Kamala D HarrisDemocrat48.9%29,520 votes
Others: 1.0% (611 votes).
Most votes in Ontario County: Donald J Trump
New York: Harris 55.9%, Trump 43.3%
100% of Canandaigua lies in Ontario County. Every 2024 race in Ontario County is on the county’s page.
Ontario County’s 2024 results →Official 2024 general election returns, as certified (MIT Election Data + Science Lab). Percentages are of votes for candidates; blank and spoiled ballots aren’t counted. Candidates are listed by votes, and party colors are neutral on purpose.
Portraits: Kamala D Harris: official vice-presidential portrait, Lawrence Jackson, The White House, 2021; Donald J Trump: official portrait, Shealah Craighead, The White House, 2017. All are U.S. government works in the public domain. A race shows photos only when every candidate has an official portrait; otherwise every candidate in it gets initials.
From town hall to Washington
Every level of government that speaks for Canandaigua.
- 1Your townTown governmentOfficials: canandaigua.govoffice.com ↗
- 2New York AssemblyState representatives
- 3New York SenateState senator
- 4GovernorStatewide
- 5U.S. HouseYour representative in Congress
- 6U.S. SenateBoth represent all of New York
Democrat · Republican · other or independent. Tap a name for their official page.
How Canandaigua compares with the towns next door
Canandaigua spent $586 per resident in 2022; the 7 neighbors that reported 2022 spent $564 to $1,346. Towns that run more services spend more. Tap a town to see its page.
| Town | Day-to-day, per resident (2022) | Tax bill |
|---|---|---|
| East Bloomfield | $564 | $5,212 |
| Hopewell | $572 | $4,094 |
| Farmington | $598 | $4,247 |
| Gorham | $774 | $3,497 |
| Bristol | $862 | $4,208 |
| Middlesex | $997 | $3,459 |
| South Bristol | $1,346 | $5,205 |
| Canandaigua | $586 | $6,718 |
Day-to-day spending in 2022, the last year every government was counted, for governments that reported it; hospital and utilities left out. Tax bill: the typical homeowner’s bill (Census ACS, 2020–24).
Reach Canandaigua’s government
The official site has phone numbers, hours and forms. Neighbors add the rest to the Handbook.
Questions about Canandaigua’s government
How much does Canandaigua spend per resident?
About $586 per resident on day-to-day services in the year to December 31, 2022, as reported to the Census Bureau. In 2022, the last full count, its $586 was more than 55% of 83 New York towns and townships of 10,000–24,999 that don’t run their own schools.
What is the property tax rate in Canandaigua?
Homeowners report a typical bill of $6,718 a year (Census ACS, 2020–24), about 1.94% of the typical home’s value, vs 1.55% across New York. For the official rate per $1,000 of assessed value, see canandaigua.govoffice.com.
Who runs Canandaigua’s government?
See canandaigua.govoffice.com for current officials. We name an official only when a public source lists a current term, and none does for Canandaigua yet.
How did Canandaigua vote in 2024?
New York counts votes by county and precinct, not by town, so there are no official results for Canandaigua alone. Ontario County, where 100% of Canandaigua lies, voted Trump 50.1%, Harris 48.9% for president; its page has every race.
How many people work for Canandaigua?
42 full-time and 17 part-time employees in March 2025, with a March payroll of $282,768 (about $3.4M a year if every month were the same), as reported to the Census Bureau.
Who represents Canandaigua in the state legislature?
State Senate District 54 (Pam Helming) and Assembly District 131 (Jeff Gallahan). The Assembly district also covers 62 other towns. Listed by Open States; districts from the Census Bureau.
Ask neighbors about Canandaigua’s government
Neighbors who’ve been to the meetings can help.
Budget and staff: U.S. Census Bureau, Census of Governments (2022, every government) and Annual Survey of State and Local Government Finances (2023–24, a sample) and the Annual Survey of Public Employment & Payroll; day-to-day spending is current operations, with hospitals, utilities and airports apart. School district: Census school finance survey, 2023–24. Property tax: Census American Community Survey, 2020–24. Elections: official 2024 returns via the MIT Election Data + Science Lab; turnout uses Census citizen voting-age population (CVAP, 2020–24). Officials: Open States, names shown only with a current term (checked October 9, 2026). Districts: Census Bureau (119th Congress, 2024 state districts); legislators: Open States and congress-legislators. How Town Hall works →