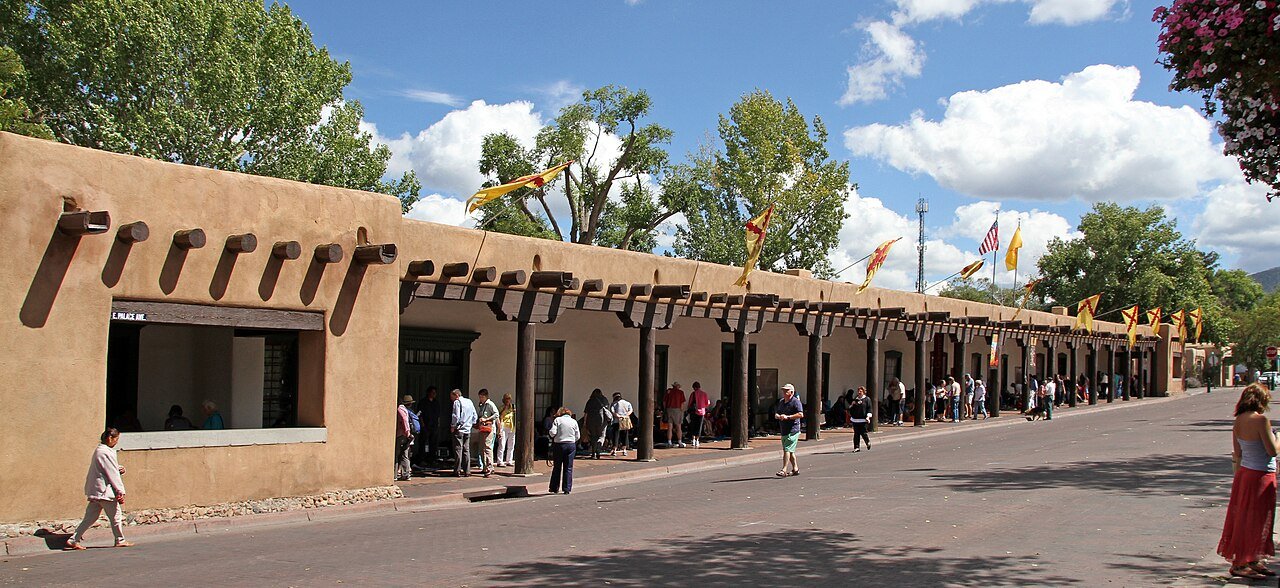
 Photo: Tony Hisgett from Birmingham, UK · CC BY 2.0
Even on the area’s higher pay, Santa Fe costs more to live in than 81% of U.S. towns
It ranks #67 of 72 in New Mexico for affordability. Up 0.7% in a year, 83% above the New Mexico typical home.
Census 2020–24 home values, rents, tax bills and cost burden, measured against the median household income of the Santa Fe, NM metro area ($79K). How TownRatings grades cost of living
The grade measures what housing costs against what households in the area earn. Santa Fe’s area earns well above the typical U.S. town ($79K against $74K), but homes, rent and taxes here run higher still. Owners keep up better than renters: 27% of owners pay 30% or more of income for housing (typical U.S. town: 20%), against 52% of renters.
In dollars
- $577Ktypical home, 83% above the New Mexico typical homeZillow, September 2026
- $1,710a month for a two-bedroom, utilities includedHUD Fair Market Rent, 2026
- 99prices across the Santa Fe metro, where the U.S. is 100 (housing 108)BEA Regional Price Parities, 2024
In paychecks the grade
- 5.6 yrsof area income buys the typical home; the typical U.S. town: 3.3$79K, Santa Fe-area income
- 22%of area income goes to the median rent; the typical U.S. town: 18%Census 2020–24
- 52%of renters pay 30%+ of income for housing; across New Mexico: 50%Census 2020–24
- 27%of owners do; the typical U.S. town: 20%Census 2020–24
Housing in Santa Fe, in brief
Homes haven’t kept up with new residents
Between the 2010 and 2020 censuses, Santa Fe gained 19,558 residents while 1,974 new homes were permitted: about 9.9 new residents per new home, against 1.2 across New Mexico. New homes ↓
A median income doesn’t stretch to the towns next door
At Santa Fe’s median income, the calculator’s budget of about $302K covers neither the typical home here ($577K) nor in any of the six neighboring towns. The least expensive is La Cienega at $517K. Can I afford it? ↓
Written from the data on this page. Home values are the Zillow Home Value Index, through September 2026; sales and supply are Redfin’s for September 2026; permits are Census figures through 2025; incomes, rents paid, taxes and ownership come from the Census American Community Survey.
What’s behind Santa Fe’s grade
Measured against what households in the area earn, Santa Fe is more affordable than 19% of U.S. towns, #67 of 72 in New Mexico. Home prices pull the grade down most; property tax holds it up.
Values have lagged New Mexico: the typical Santa Fe home is up 15.8% in five years, against 25.1% statewide (Zillow).
Up 15.8% in five years
Slower than New Mexico (25.1%).
Show as a table
| January | Santa Fe | New Mexico |
|---|---|---|
| 2017 | $315,000 | $177,000 |
| 2018 | $350,000 | $183,000 |
| 2019 | $366,000 | $191,000 |
| 2020 | $402,000 | $203,000 |
| 2021 | $451,000 | $228,000 |
| 2022 | $517,000 | $261,000 |
| 2023 | $547,000 | $285,000 |
| 2024 | $568,000 | $299,000 |
| 2025 | $579,000 | $310,000 |
| 2026 | $574,000 | $313,000 |
| September 2026 | $577,000 | $316,000 |
A typical Santa Fe home worth $313K in October 2016 is worth about $577K today.
Zillow Home Value Index: the typical value of all homes (middle third), smoothed and seasonally adjusted, through September 2026.
A balanced market
About 5.7 months of supply: neither buyers nor sellers have a clear edge.
Under ~4 months of supply favors sellers; over ~6 favors buyers.
Redfin Data Center, all residential sales, September 2026.
A typical home costs 5.6 years of area income
The calculator starts from the area income the grade uses. Switch to Santa Fe’s own median, or type yours.
That’s $250K short of a typical Santa Fe home.
A two-bedroom rents for about $1,710 a month here, $1,540 less than owning.
An estimate, not a loan offer: payments of up to 28% of income, a 30-year fixed loan, Santa Fe’s typical property tax (0.48% of value a year, from the Census) and insurance of about 0.35%. Mortgage insurance, HOA fees and other debts aren’t included.
A two-bedroom rents for about $1,710
Renters already here pay a median of $1,463, so moving in tends to cost more than staying put.
Fair Market Rent a month, utilities included
U.S. Department of Housing and Urban Development, Fair Market Rents by ZIP code (Santa Fe, NM MSA): the 40th-percentile rent plus utilities for a standard unit. Median rent and renters: U.S. Census Bureau, American Community Survey.
495 new homes permitted in 2025
Builders were permitted 495 new homes in Santa Fe in 2025: 251 single-family houses and 244 in buildings with two or more homes, worth about $132.5 million to build. That's 5.6 per 1,000 residents, about the pace of New Mexico as a whole. Over the past 10 years, Santa Fe has permitted 4,872 homes in all.
Between the 2010 and 2020 censuses, Santa Fe gained 19,558 residents while 1,974 new homes were permitted: about 9.9 new residents per new home. Population grew faster than building, so existing homes filled up: a sign of tight supply. Across New Mexico: 1.2 new residents per new home.
Every year as a table
| Year | New homes | Single-family | 2+ per building | Value |
|---|---|---|---|---|
| 2026 (Jan–Aug) | 241 | 182 | 59 | $77.5 million |
| 2025 | 495 | 251 | 244 | $132.5 million |
| 2024 | 244 | 244 | 0 | $91.4 million |
| 2023 | 926 | 264 | 662 | $194.4 million |
| 2022 | 590 | 177 | 413 | $134.1 million |
| 2021 | 840 | 228 | 612 | $133.8 million |
| 2020 | 577 | 279 | 298 | $117.6 million |
| 2019 | 589 | 344 | 245 | $108.7 million |
| 2018 | 273 | 243 | 30 | $66 million |
| 2017 | 221 | 221 | 0 | $50.8 million |
| 2016 | 117 | 117 | 0 | $29.2 million |
| 2015 | 110 | 110 | 0 | $26.6 million |
| 2014 | 161 | 161 | 0 | $37.1 million |
| 2013 | 183 | 159 | 24 | $32.7 million |
| 2012 | 130 | 130 | 0 | $17.3 million |
| 2011 | 94 | 94 | 0 | $12.5 million |
| 2010 | 96 | 96 | 0 | $12.8 million |
| 2009 | 102 | 102 | 0 | $13.6 million |
| 2008 | 140 | 140 | 0 | $18.7 million |
| 2007 | 277 | 277 | 0 | $36.9 million |
| 2006 | 417 | 417 | 0 | $55.7 million |
| 2005 | 580 | 580 | 0 | $77.1 million |
| 2004 | 561 | 561 | 0 | $75.9 million |
| 2003 | 561 | 561 | 0 | $70.7 million |
| 2002 | 604 | 582 | 22 | $77.9 million |
| 2001 | 537 | 472 | 65 | $65.2 million |
| 2000 | 395 | 354 | 41 | $49.1 million |
Homes authorized by building permits, counted in the year the permit was issued. U.S. Census Bureau, Building Permits Survey.
High tax bills, but a low tax rate
The median bill is $2,126 (New Mexico: $1,731), because homes cost more. As a share of value it’s 0.48% a year, against 0.70% statewide.
Census American Community Survey 2020–24: the median real-estate tax bill homeowners report, and that bill ÷ the median home value. Bills include town, school and county taxes. The Census reports bills over $10,000 only as “$10,000+”.
The rest of a budget near Santa Fe
Only figures published free for the whole country, each labeled with the area it covers: the Santa Fe, NM metro area, or New Mexico. Groceries follow the goods price level; nobody publishes them town by town.
| Cost | Here | Compared with | Area | Source |
|---|---|---|---|---|
| Prices overall U.S. = 100 | 99 | NM 92 | metro | BEA, 2024 |
| Goods (groceries, clothing, cars…) U.S. = 100 | 96 | NM 96 | metro | BEA, 2024 |
| Utilities U.S. = 100 | 77 | NM 78 | metro | BEA, 2024 |
| Other services U.S. = 100 | 99 | NM 99 | metro | BEA, 2024 |
Price levels: U.S. Bureau of Economic Analysis, Regional Price Parities 2024 (metro area and state). Electricity: U.S. Energy Information Administration, Electric Power Monthly, table 5.6.A.
Santa Fe vs. its neighbors
Of the 1 towns here with a Zillow value, Santa Fe has the lowest. Santa Fe Foothills and Tano Road and Conejo and Tesuque and Tres Arroyos and La Cienega have no Zillow value, so they are in the table only.
Cost next door · one source per column
| Town | Cost | Typical home Zillow, September 2026 | Median value Census 2020–24 | Tax rate bill ÷ value | 2-bed rent HUD 2026 |
|---|---|---|---|---|---|
| Santa Fe | C− | $577K | $445K | 0.48% | $1,710 |
| La Cienega | C+ | — | $517K | 0.38% | $1,590 |
| Tres Arroyos | C | — | $679K | 0.47% | $1,560 |
| Tano Road | D | — | $1.1M | 0.50% | $1,500 |
| Santa Fe Foothills | – | — | $1.2M | 0.39% | $1,750 |
| Conejo | – | — | $1.0M | 0.48% | $2,050 |
| Tesuque | C− | — | $849K | 0.32% | $1,550 |
| Hyde Park | – | — | $1.4M | 0.39% | $1,930 |
“—” under Zillow: Zillow publishes no value for that town, so it’s left blank rather than mixed with Census figures. “—” under Cost: not graded (too little Census data, or under 1,000 residents).
Questions about the cost of living in Santa Fe
Is Santa Fe expensive to live in?
Measured against what households in the area earn, Santa Fe costs more than 81% of U.S. towns: a C− for cost of living, #67 of 72 in New Mexico. The typical home costs 5.6 years of the median household income of the Santa Fe, NM metro area ($79K).
How much does a house cost in Santa Fe?
About $577K, Zillow’s typical value for September 2026, up 0.7% in a year. The New Mexico typical home is $316K.
What salary do you need to live in Santa Fe?
To buy the typical home with 20% down at 6.3%, about $139,000 a year, keeping the payment (about $3,250 a month with tax and insurance) at 28% of income. To rent a two-bedroom at 30% of income, about $68,000.
How much is rent in Santa Fe?
HUD puts a two-bedroom at about $1,710 a month with utilities, the going rate for someone moving in. Renters already here pay a median of $1,463 (Census 2020–24).
What are property taxes in Santa Fe?
The median bill is $2,126 a year, 0.48% of the median home value (New Mexico: $1,731, 0.70%), from the Census 2020–24.
Are home prices in Santa Fe going up?
Barely: up 0.7% in the past year and 15.8% in five years, against 25.1% across New Mexico (Zillow).
Neighbors talk housing
What Santa Fe buyers, sellers and renters are saying.
Home values: Zillow Home Value Index (ZHVI), Zillow Research, September 2026. Sales, days on market and supply: Redfin Data Center, September 2026. Income, ownership, taxes and rent: U.S. Census Bureau, American Community Survey. New homes: U.S. Census Bureau, Building Permits Survey. Fair Market Rents: U.S. Department of Housing and Urban Development. The calculator is an estimate, not a loan offer. Regional price levels: BEA; electricity: EIA. How TownRatings grades cost of living.