294 years in pictures
Census counts: 829 in 1790, 6,224 in 2020. The archive holds 6 old photos and papers going back to 1794 and 7 maps from 1886 on.
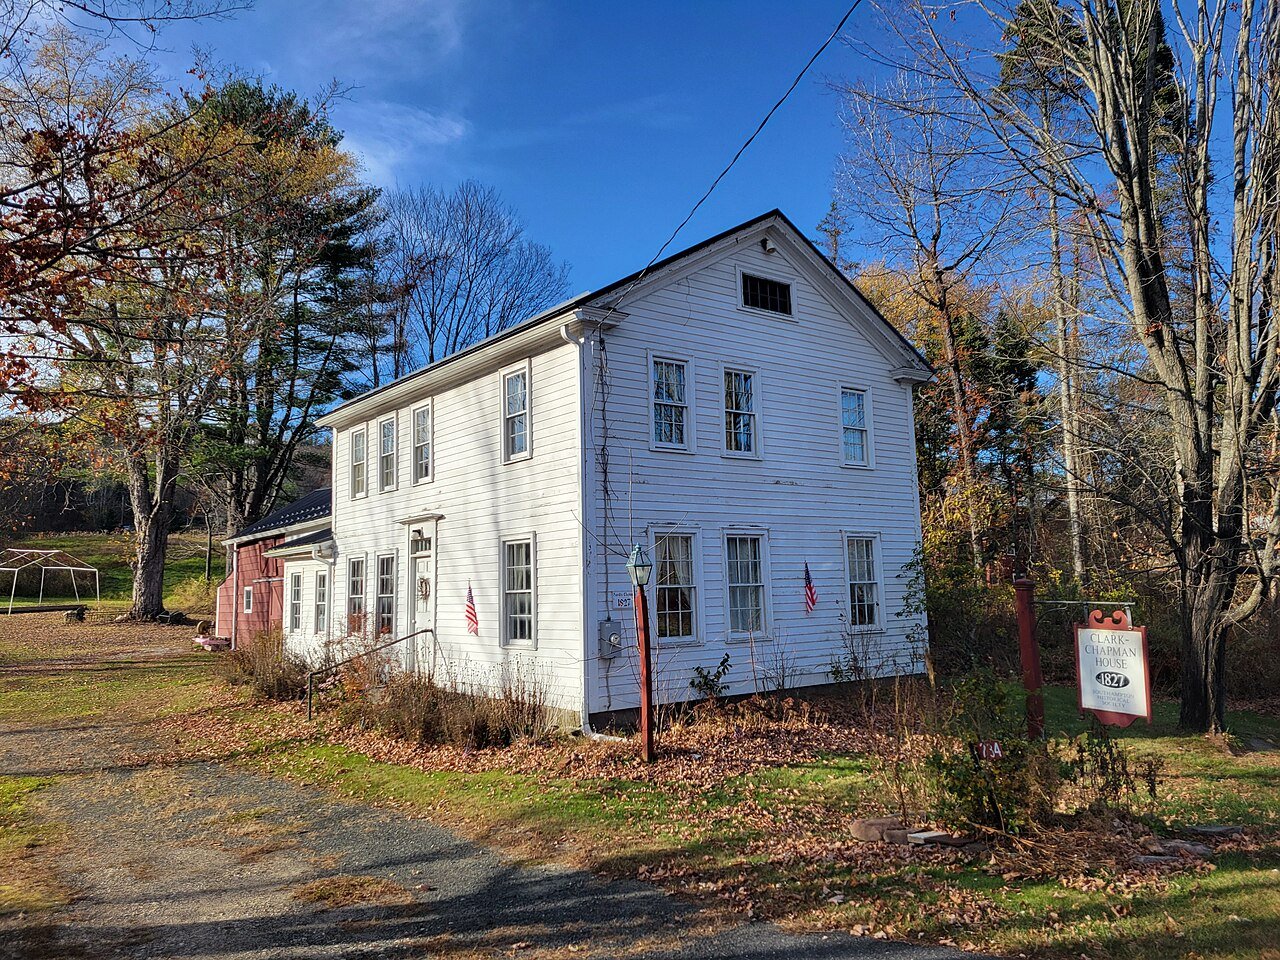
3 places on the National Register of Historic Places.
- 1732Southampton is established
Each edition grades its towns against each other only.

Southampton grades B+ overall, ranked 124th of 282 in Massachusetts, with clear strengths and some subjects that lag. The median household earns $123K and residents are healthier than 91% of U.S. towns on CDC estimates. It also does better than most on safety: crime is low: it reports less per resident than 82% of U.S. towns. Its lowest everyday mark is in cost of living: the typical home is worth about $499K, 5.7 years of the Amherst Town metro’s $87K median household income. 24% of the land in Southampton is conserved, above both the Massachusetts town median (19%) and the median of U.S. towns (4.3%). Only 5 of Massachusetts’ 325 towns score lower on walkability. Southampton has 3 places on the National Register of Historic Places, among them Southampton Center Historic District and Lockville Historic District.
Where Southampton beats most towns.
Census counts: 829 in 1790, 6,224 in 2020. The archive holds 6 old photos and papers going back to 1794 and 7 maps from 1886 on.
3 places on the National Register of Historic Places.
Each subject compared with towns across the country (schools within Massachusetts), ordered by how far Southampton is from typical.
How TownRatings grades towns →
Museums, parks, gardens and other places to visit around Southampton. Close and well known come first.
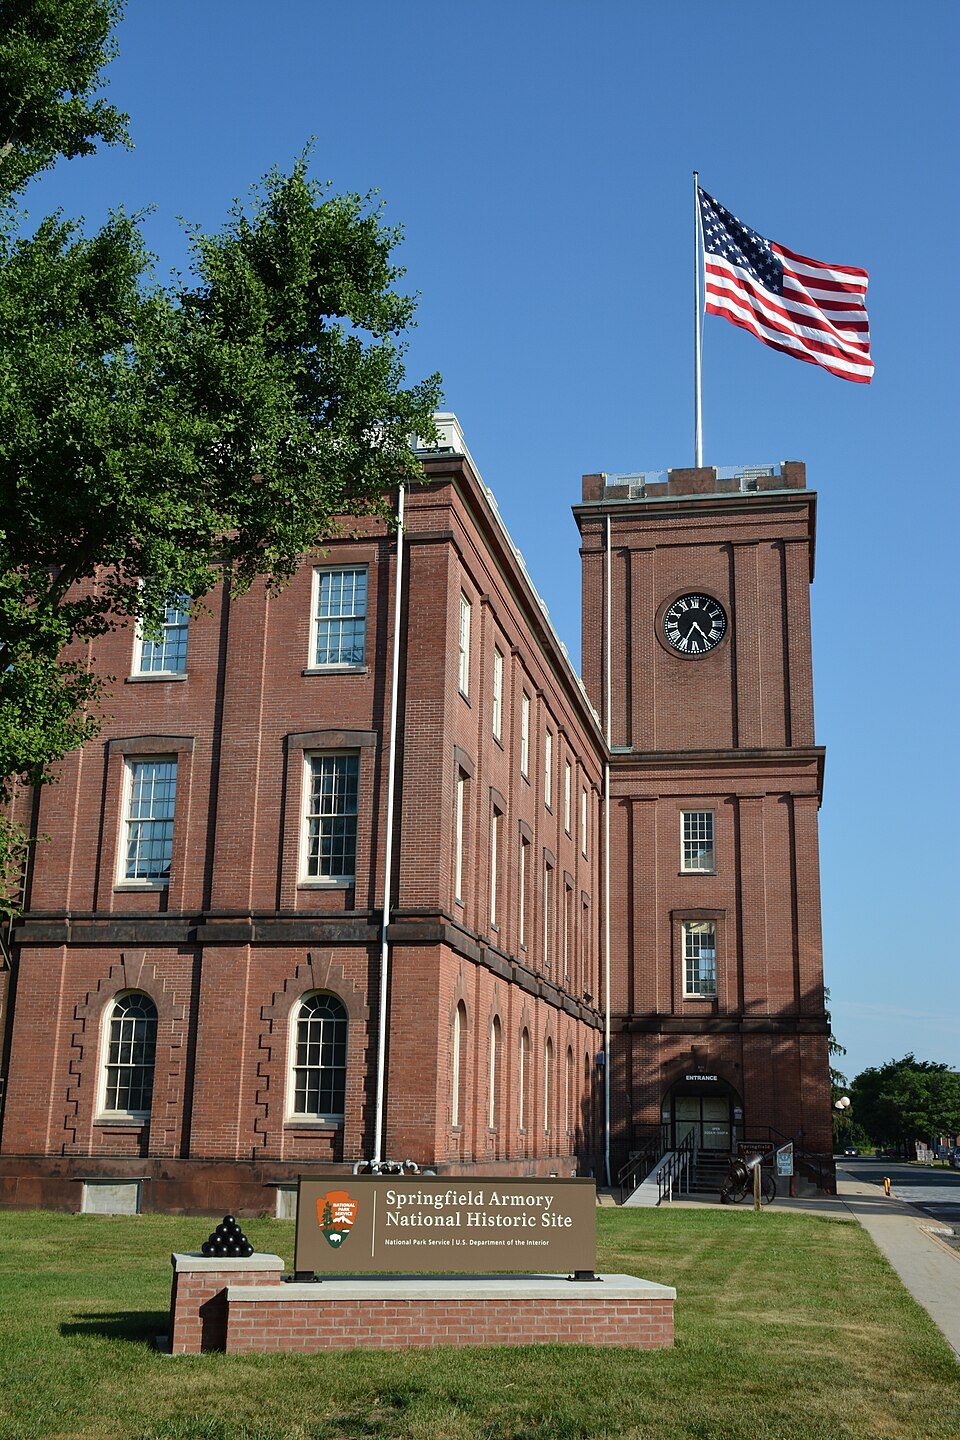
12 mi National Historic SiteSpringfield Armory National Historic Site14K visitors a year
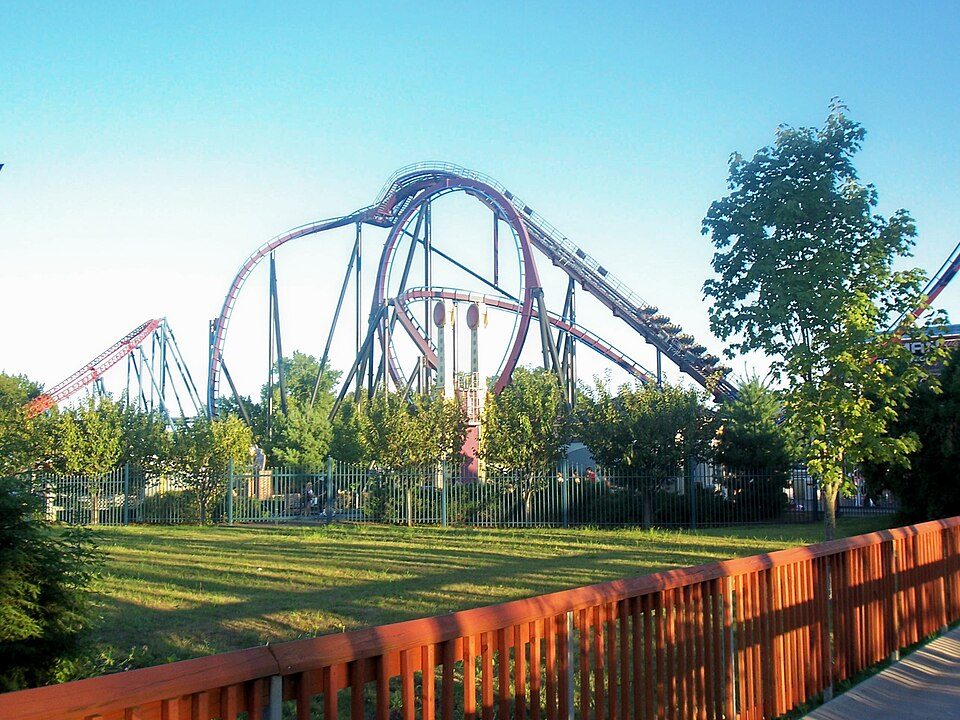
15 mi Theme parkSix Flags New England
24 mi LakeQuabbin Reservoir
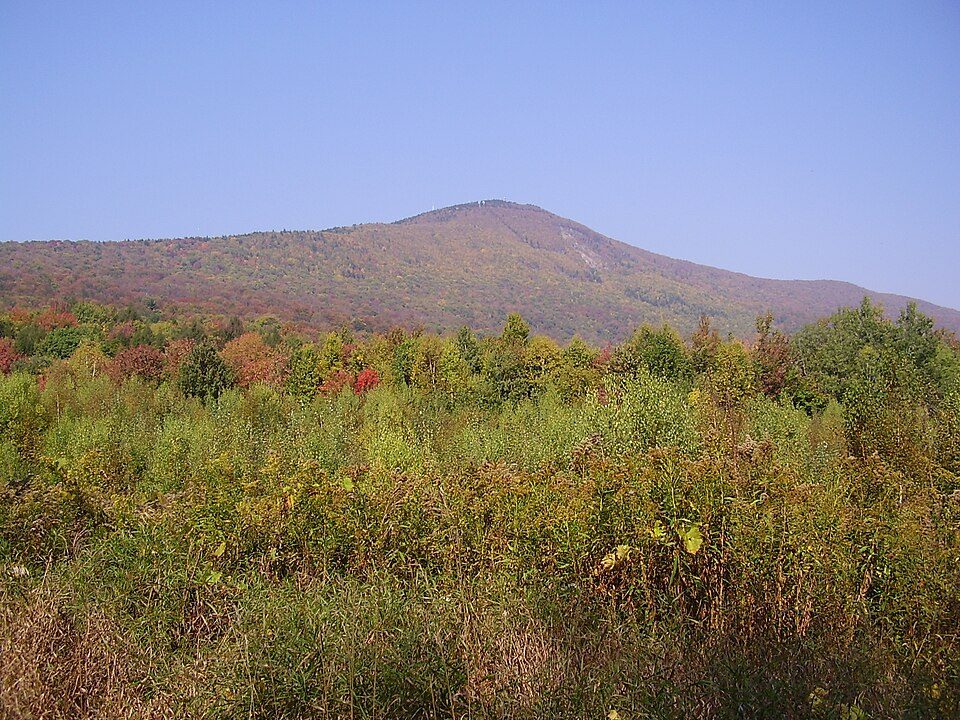
36 mi MountainMount Greylock
32 mi Stadium & arenaPeoplesBank Arena
7 mi MuseumVolleyball Hall of FameSpringfield Armory National Historic Site: National Park Service, Public domain · Six Flags New England: Canadaolympic989, Public domain · Quabbin Reservoir: engineerchange, CC BY 2.0 · Mount Greylock: Jstergis, CC BY 3.0 · PeoplesBank Arena: PeoplesBank Arena, CC BY 2.5 · Volleyball Hall of Fame: John Phelan, CC BY-SA 3.0
Who provides power, water and the rest in Southampton, and how to reach them.
EPA SDWIS (Oct 9, 2026) · HIFLD + EIA-861 2025 · Census 2020 ZCTAs · NCES 2024–25 · registration: vote.gov, updated Nov 18, 2024.
Ordered by what stands out in Southampton.
Southampton reports less crime than Easthampton or any other graded neighbor, has commutes shorter than most of Massachusetts and is healthy by national standards but mid-pack in Massachusetts.
Within Massachusetts it is healthier than 65% of the 279 graded towns: Massachusetts sets a high bar. Its A for health tops all 4 graded neighbors; Westhampton (A−) comes closest.
17% of adults get no exercise outside work in Southampton, where Massachusetts’ towns sit at 19% and U.S. towns at 25%. 26% of adults have been diagnosed with depression in Southampton. Southampton beats the Massachusetts average on 9 of 32 CDC measures and trails it on 1.
| Southampton | Massachusetts towns | U.S. towns | |
|---|---|---|---|
| Get no exercise (CDC PLACES) | 17% | 19% | 25% |
| Depression (CDC PLACES) | 26% | 24% | 23% |
| Yearly checkup (CDC PLACES) | 83% | 82% | 79% |
| Fair or poor health (CDC PLACES) | 14% | 15% | 19% |
| What stands out | Southampton | MA |
|---|---|---|
| Fewer adults facing food insecurity | 7.7% | 12.4% |
| Fewer uninsured adults | 3.4% | 5.2% |
| More adults who have had cancer | 10.6% | 8.5% |
CDC PLACES 2025 · modeled estimates for adults · CMS · HRSA
Its public schools are run by the Southampton school district. Its one school is below.
| School | Level | Students | Letter |
|---|---|---|---|
| William E NorrisLargest public elementary schoolGrades PK–6 | Grades PK–6 | 475 | B− |
NCES · EDFacts · graded within MA on state tests and graduation
Its A− tops all 3 graded towns on its borders; Easthampton (B+) comes closest. Violent crime is rare: 6 reported in 2025, 1 per 1,000 residents.
FBI crime data, 2025 · crimes reported to police
The average commute for its 2,878 working residents takes 22.4 minutes, against 29.1 across Massachusetts.
Most working residents leave Southampton for work: only 8% work in town. Southampton’s average trip to work is 22 minutes. Since 2013, Southampton has added 64 jobs, to 1,147 in 2023.
| Southampton | Massachusetts towns | U.S. towns | |
|---|---|---|---|
| Average trip to work | 22 minutes | 30 minutes | 25 minutes |
| Work from home | 8.2% | 18% | 11% |
| Below the poverty line | 2.6% | 6% | 9.6% |
| Median household income | $123,000 | $120,000 | $80,000 |
Census LEHD 2023 · ACS
32 miles of trail in 4 parks and preserves. The trail density in Southampton is 1.1 miles per square mile. The biggest park or preserve is Southampton Wildlife Management Area, at 127 acres.
| Biggest places to walk | Trails | Acres |
|---|---|---|
| 1. Southampton Wildlife Management Area | — | 127 |
| 2. Manhan Meadow | — | 42 |
| 3. Conant Park | — | 23 |
Trails & parks © OpenStreetMap contributors · Conserved land: USGS PAD-US
The typical Southampton home is worth about $499,000, up 3.4% in a year, 24% below the Massachusetts typical home.
Zillow Home Value Index · Redfin Data Center
Expected storm and flood damage is lower than in 70% of U.S. communities. Since 1978, 5 flood insurance claims have been paid out in Southampton.
FEMA flood insurance claims · FEMA National Risk Index · OpenFEMA
Southampton has chilly, snowy winters and warm summers, with plenty of rain. Only 6 of the 283 Massachusetts towns we compare have a higher July high than Southampton.
NOAA U.S. Climate Normals, 1991–2020
People 65 and older are 22% of residents (18% statewide). 41% of Southampton adults 25 and older hold a bachelor’s degree or more. Southampton has lost 2.3% of its people since 2020, down to 6,085 in the Census Bureau’s 2025 estimate.
| Southampton | Massachusetts towns | U.S. towns | |
|---|---|---|---|
| Aged 65 or older | 22% | 19% | 18% |
| Bachelor’s degree or more, 25+ | 41% | 47% | 29% |
| Median age | 43.4 years | 43.4 years | 40.5 years |
45% women, 55% men
About 120 men for every 100 women (the survey’s margin: ±3.5 points). Across Massachusetts, 51.1% of residents are women.
| Southampton | MA | U.S. | |
|---|---|---|---|
| Under 10 | 11% | 10.2% | 11.6% |
| 10 to 17 | 8.1% | 9.2% | 10.3% |
| 18 to 24 | 10.5% | 9.8% | 9.1% |
| 25 to 34 | 11% | 14% | 13.7% |
| 35 to 44 | 11.5% | 13% | 13.2% |
| 45 to 54 | 14% | 12.3% | 12.2% |
| 55 to 64 | 12% | 13.6% | 12.7% |
| 65 to 74 | 15.3% | 10.5% | 10.2% |
| 75 and older | 6.6% | 7.4% | 7% |
| No diploma | 2.3% | 8.6% | 10.4% |
| High school | 25.6% | 22.6% | 26% |
| Some college | 17.1% | 14.1% | 19.1% |
| Associate’s | 13.9% | 7.5% | 8.8% |
| Bachelor’s | 26.6% | 25.5% | 21.6% |
| Graduate | 14.5% | 21.8% | 14.1% |
Census population estimates, 2025 · U.S. Census Bureau · ACS 2020-2024 5-year estimates
13 within 15 miles of the center of Southampton
About 5 of every 100 Southampton residents are enrolled in college, against 8 across Massachusetts.
Where Southampton’s working residents go each day. Line width shows the share.
Census LEHD 2023
3 places in Southampton on the National Register of Historic Places.
5 notable people were born in Southampton.
Town in Massachusetts, United States
Southampton ( ) is a town in Hampshire County, Massachusetts, United States. It was established first as a district of Northampton in 1732. It was incorporated in 1775. The name Southampton was given to it during its first town meeting in 1773. Its ZIP code is 01073. Southampton is part of the Springfield, Massachusetts Metropolitan Statistical Area. The town had a population of 6,224 at the 2020 census.
From Wikipedia, licensed CC BY-SA 4.0 · facts via Wikidata (CC0)
6 towns share a border with Southampton.
It grades higher overall than all 3 graded towns on its borders; Westfield (C+) comes closest.
| Town | MA rank | Overall | Cost | Safety | Schools | Health |
|---|---|---|---|---|---|---|
| Southampton | #124 | B+ | C | A− | B− | A |
| Easthampton | #232 | C+ | D | B+ | C+ | — |
| Holyoke | #282 | D− | C− | D− | D− | D |
| Montgomery | — | — | — | — | — | — |
| Westfield | #229 | C+ | C− | B | C | B |
| Westhampton | — | — | C− | — | B | A− |
| Huntington | — | — | C | — | C− | B+ |
Westhampton and Huntington have fewer than 2,500 residents, so they get subject grades but no overall grade. Westhampton and Huntington report no FBI crime data of their own. Montgomery isn’t graded (fewer than 1,000 residents, or not enough data). Compare Southampton with a neighbor →
Short answers, built from the data on this page.
By most measures, yes. Southampton grades B+ overall, better than 71% of U.S. towns and #124 of 282 in Massachusetts. It grades A for health, A− for safety and B− for schools. Walkability is its weak spot, with a D.
Cost of living, which also weighs rents, property taxes and how many households pay 30% or more of their income for housing, grades C.
Southampton was established in 1732 and has 3 places on the National Register of Historic Places. 5 notable people were born here, including Alvan Wentworth Chapman and Samuel C. Pomeroy.