Ocean Bluff-Brant RockMA
The town has 4,540 residents and lies in Massachusetts.
Is Ocean Bluff-Brant Rock a good place to live?
9.5% of residents are under 18 in Ocean Bluff-Brant Rock, below both Massachusetts’ towns (20%) and U.S. towns (22%). Only 3 of the 284 Massachusetts towns we compare have a lower share of working residents who work in town than Ocean Bluff-Brant Rock. Ocean Bluff-Brant Rock’s concentration of trails is 0.1 miles per square mile, against 1.8 in Massachusetts’ towns and 0.4 across U.S. towns. The biggest park or preserve is Bass Creek Meadow, at 35 acres. We don’t grade Ocean Bluff-Brant Rock yet; the figures below are still real.
Ocean Bluff-Brant Rock lives by the ocean
Coastal flooding makes up 62% of the storm damage FEMA expects here.
FEMA National Risk Index · OpenFEMA · OpenStreetMap
Fenway Park and 163 more within 40 miles
Museums, parks, gardens and other places to visit around Ocean Bluff-Brant Rock. Close and well known come first.
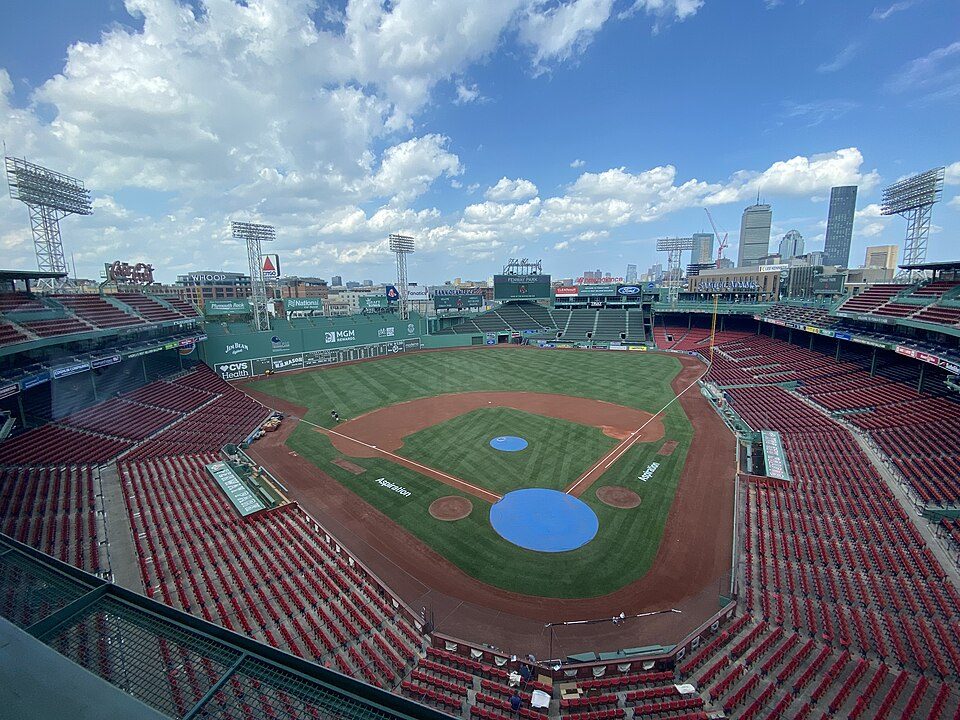 Big draw29 mi Stadium & arenaFenway Park
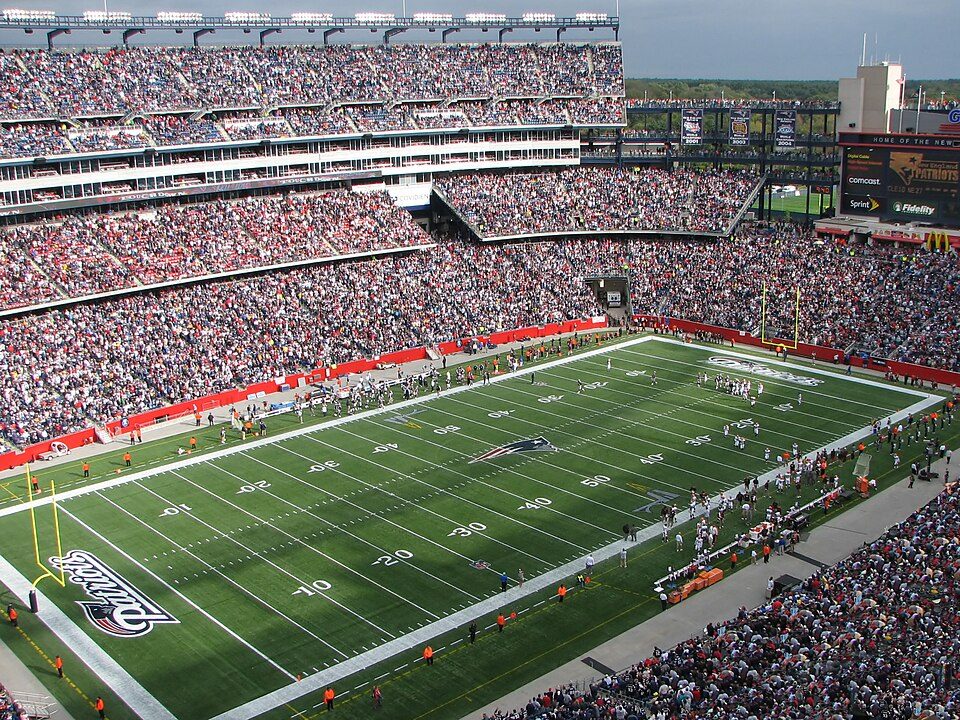 Big draw32 mi Stadium & arenaGillette Stadium
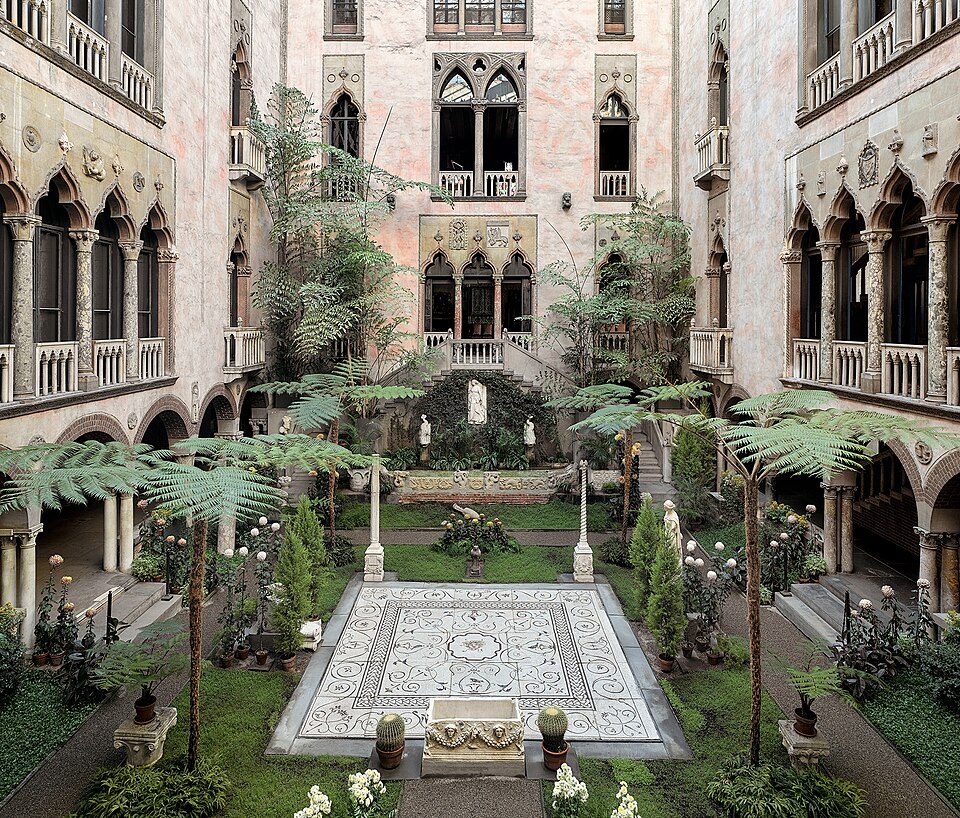 Big draw28 mi MuseumIsabella Stewart Gardner Museum
 38 mi MuseumUSS Massachusetts
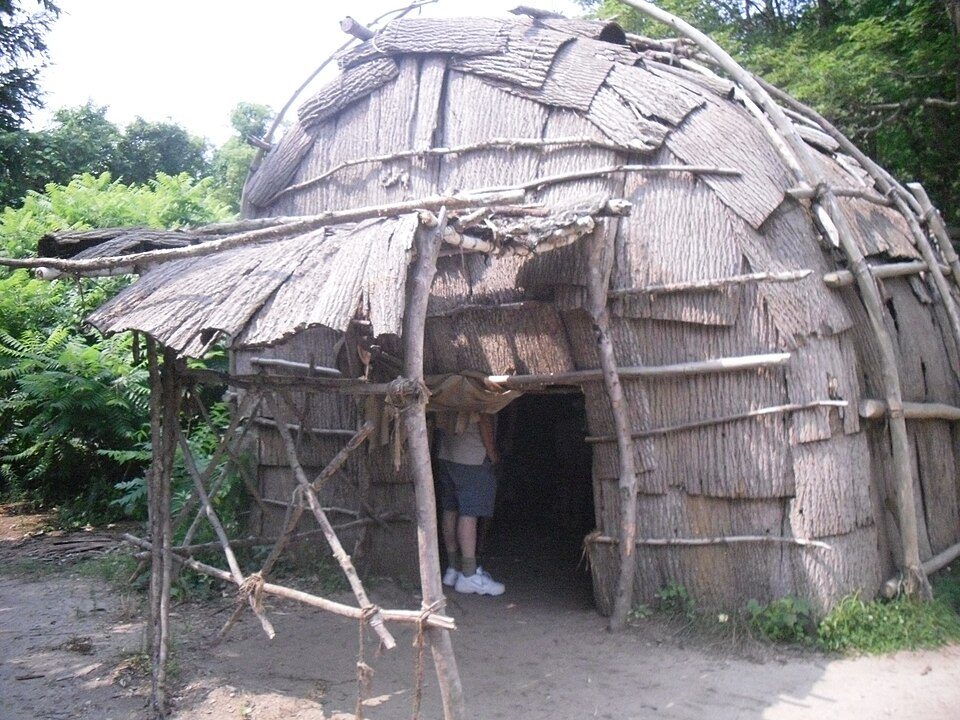 11 mi MuseumPlimoth Patuxet
 28 mi AttractionFreedom Trail
Photo credits
Fenway Park: Gatorfan252525, CC BY-SA 4.0 · Gillette Stadium: Bernard Gagnon, CC BY-SA 3.0 · Isabella Stewart Gardner Museum: Sean Dungan, CC BY-SA 4.0 · USS Massachusetts: USN, Public domain · Plimoth Patuxet: Tr!sie, CC BY-SA 3.0 · Freedom Trail: Ingfbruno, CC BY-SA 3.0


Moving to Ocean Bluff-Brant Rock: who provides what
Ocean Bluff-Brant Rock is unincorporated, so Plymouth County and regional agencies provide most services.
EPA SDWIS (Oct 9, 2026) · HIFLD + EIA-861 2025 · Census 2020 ZCTAs · NCES 2024–25 · registration: vote.gov, updated Nov 18, 2024.
The data
Ordered by what stands out in Ocean Bluff-Brant Rock.
Ocean Bluff-Brant Rock has 0.2 jobs for every working resident, so most commute out
The top destinations are Marshfield (15%), Boston (12%) and Plymouth (4%). Between 2013 and 2023, jobs in Ocean Bluff-Brant Rock rose by 48, to 361. For Ocean Bluff-Brant Rock, the mean commuting time is 35 minutes. Half the trips to work are shorter than 20 miles.
| Ocean Bluff-Brant Rock | Massachusetts towns | U.S. towns | |
|---|---|---|---|
| Average trip to work | 35 minutes | 30 minutes | 25 minutes |
| Median household income | $119,000 | $120,000 | $80,000 |
| Below the poverty line | 5.3% | 6% | 9.6% |
Where working residents work
Census LEHD 2023 · ACS
Natural hazards: high risk in Ocean Bluff-Brant Rock, mostly coastal flooding
The FEMA hazard score in Ocean Bluff-Brant Rock is 77 of 100. Since 1991, Ocean Bluff-Brant Rock has seen 76 flood insurance claims paid out. Of the losses FEMA expects here, 62% come from coastal flooding and 28% from inland flooding.
FEMA flood insurance claims · FEMA National Risk Index · OpenFEMA
Four seasons and pleasant summers: that is Ocean Bluff-Brant Rock’s year
Expect July afternoons of 82° and January nights of 22°, with about 38 inches of snow a winter.
Typical low → high °F
NOAA U.S. Climate Normals, 1991–2020
Ocean Bluff-Brant Rock keeps 9.4% of its land conserved
0.6 miles of trail wind through 5 parks and preserves. Parks and preserves in Ocean Bluff-Brant Rock: 5, covering 85 acres.
| Biggest places to walk | Trails | Acres |
|---|---|---|
| 1. Bass Creek Meadow | — | 35 |
| 2. West Brook Meadow | — | 25 |
| 3. Peter Igo Park | — | 19 |
Trails & parks © OpenStreetMap contributors · Conserved land: USGS PAD-US
How healthy Ocean Bluff-Brant Rock is
11% of Ocean Bluff-Brant Rock adults smoke cigarettes. Of 32 CDC measures, Ocean Bluff-Brant Rock beats the Massachusetts average on 9 and trails it on 3. Two figures for adults here: 29% have obesity, 31% feel lonely.
| Ocean Bluff-Brant Rock | Massachusetts towns | U.S. towns | |
|---|---|---|---|
| Yearly checkup (CDC PLACES) | 83% | 82% | 79% |
| Obesity (CDC PLACES) | 29% | 28% | 35% |
| Feel lonely (CDC PLACES) | 31% | 33% | 33% |
| No health insurance, 18–64 (CDC PLACES) | 3.2% | 3.7% | 8.1% |
| What stands out | Ocean Bluff-Brant Rock | MA |
|---|---|---|
| Fewer uninsured adults | 3.2% | 5.2% |
| Fewer adults facing food insecurity | 8.2% | 12.4% |
| More adults who have had cancer | 11.3% | 8.5% |
CDC PLACES 2025 · modeled estimates for adults · CMS · HRSA
A home in Ocean Bluff-Brant Rock sells for about $737K at the median
The going rate for rent for Ocean Bluff-Brant Rock comes to $1,409 a month. The share of households in Ocean Bluff-Brant Rock who own their home: 82%. Also worth knowing: homes sold in Ocean Bluff-Brant Rock spent a median 18 days on the market.
| Ocean Bluff-Brant Rock | Massachusetts towns | U.S. towns | |
|---|---|---|---|
| Households that own their home | 82% | 79% | 73% |
| Median rent | $1,409 a month | $1,683 a month | $1,185 a month |
Census ACS, 2020–24 · Zillow Home Value Index · Redfin Data Center
Everything we know about Ocean Bluff-Brant Rock
Colleges nearby
None within 15 miles of Ocean Bluff-Brant Rock; the nearest are
About 5 of every 100 Ocean Bluff-Brant Rock residents are enrolled in college, against 8 across Massachusetts.
96% of working residents leave Ocean Bluff-Brant Rock for work
Where Ocean Bluff-Brant Rock’s working residents go each day. Line width shows the share.
Census LEHD 2023
Ocean Bluff-Brant Rock’s neighbors
4 towns share a border with Ocean Bluff-Brant Rock.
| Town | MA rank | Overall | Cost | Safety | Schools | Health |
|---|---|---|---|---|---|---|
| Ocean Bluff-Brant Rock | — | — | — | — | — | — |
| Marshfield | #74 | A | D | A | B+ | A |
| Cedar Crest | — | — | — | — | — | — |
| Green Harbor | — | — | — | — | — | — |
| Scituate | #21 | A+ | D | A+ | A | A+ |
Ocean Bluff-Brant Rock, Cedar Crest and Green Harbor aren’t graded (fewer than 1,000 residents, or not enough data). Compare Ocean Bluff-Brant Rock with a neighbor →
Questions about Ocean Bluff-Brant Rock
Short answers, built from the data on this page.
Is Ocean Bluff-Brant Rock, MA a good place to live?
We don’t grade Ocean Bluff-Brant Rock yet; the figures below are still real.