
Harwich CenterMA
Population 1,774: a town in Massachusetts.
Is Harwich Center a good place to live?
No town among the 284 in Massachusetts we compare has a lower share of working residents who work in town than Harwich Center. The biggest park or preserve is Island Pond Conservation Area, at 41 acres. We don’t grade Harwich Center yet; the figures below are still real.
Harwich Center has grown 11% from 2010 to 2020
1,798 counted in 2010 and 1,995 in 2020.
U.S. Census 2010 & 2020 counts
The data
Ordered by what stands out in Harwich Center.
Harwich Center is older than the Massachusetts average
47% of Harwich Center adults 25 and older hold a bachelor’s degree or more. People 65 and older are 33% of residents (18% statewide); children under 18 are 10% of residents (19% statewide). In Harwich Center, the median age is 54.5 years.
| Harwich Center | Massachusetts towns | U.S. towns | |
|---|---|---|---|
| Median age | 54.5 years | 43.4 years | 40.5 years |
| Bachelor’s degree or more, 25+ | 47% | 47% | 29% |
Ages · share of residents
Education · adults 25 and older
Women and men · all residents
Somewhere between 34% and 77% women
The Census survey reached too few of Harwich Center’s residents to say more: its margin here is ±21.8 points. Across Massachusetts, 51.1% of residents are women.
| Harwich Center | MA | U.S. | |
|---|---|---|---|
| Under 10 | 3.7% | 10.2% | 11.6% |
| 10 to 17 | 6.5% | 9.2% | 10.3% |
| 18 to 24 | 8.5% | 9.8% | 9.1% |
| 25 to 34 | 10.5% | 14% | 13.7% |
| 35 to 44 | 7.2% | 13% | 13.2% |
| 45 to 54 | 14.7% | 12.3% | 12.2% |
| 55 to 64 | 16.1% | 13.6% | 12.7% |
| 65 to 74 | 20.8% | 10.5% | 10.2% |
| 75 and older | 12% | 7.4% | 7% |
| No diploma | 1.8% | 8.6% | 10.4% |
| High school | 26.8% | 22.6% | 26% |
| Some college | 17.3% | 14.1% | 19.1% |
| Associate’s | 7.4% | 7.5% | 8.8% |
| Bachelor’s | 21.2% | 25.5% | 21.6% |
| Graduate | 25.4% | 21.8% | 14.1% |
U.S. Census Bureau · ACS 2020-2024 5-year estimates · in a town of 1,800, single groups can be off by several points
Most of Harwich Center’s workers head elsewhere: there are 0.6 jobs for each of them
Commuting out is the norm in Harwich Center: 3% of working residents work locally. Employers in Harwich Center shed 327 jobs between 2013 and 2023, to 489. In Harwich Center, the typical journey to work is 24 minutes. Half commute less than 9 miles.
| Harwich Center | Massachusetts towns | U.S. towns | |
|---|---|---|---|
| Average trip to work | 24 minutes | 30 minutes | 25 minutes |
| Median household income | $85,000 | $120,000 | $80,000 |
| Below the poverty line | 7.5% | 6% | 9.6% |
Where working residents work
Census LEHD 2023 · ACS
24.1% of Harwich Center is conserved land
The concentration of trails in Harwich Center is 1.4 miles per square mile. Trails total 3.3 miles in 11 parks and preserves.
| Biggest places to walk | Trails | Acres |
|---|---|---|
| 1. Texeira Conservation Area | 0.7 mi | 17 |
| 2. Island Pond Conservation Area | 0.6 mi | 41 |
| 3. Brooks Park | 0.2 mi | 18 |
Trails & parks © OpenStreetMap contributors · Conserved land: USGS PAD-US
Compared with most of Massachusetts and the rest of the country, a typical July afternoon in Harwich Center is cooler
Summers in Harwich Center are pleasant, and winters chilly. July afternoons reach 78°, January nights drop to 25° and about 25 inches of snow falls in a winter.
Typical low → high °F
NOAA U.S. Climate Normals, 1991–2020
Harwich Center stands out in Massachusetts and nationally, with more of its adults who had a checkup this year
The share of adults in Harwich Center who have been diagnosed with depression: 22%. Only 3 of the 280 Massachusetts towns we compare have a lower share of adults who binge drink than Harwich Center. This Massachusetts town does better than the Massachusetts average on 15 of 32 CDC measures and worse on 7.
| Harwich Center | Massachusetts towns | U.S. towns | |
|---|---|---|---|
| Yearly checkup (CDC PLACES) | 87% | 82% | 79% |
| Binge drink (CDC PLACES) | 13% | 17% | 16% |
| Frequent mental distress (CDC PLACES) | 13% | 16% | 17% |
| Sleep under 7 hours (CDC PLACES) | 29% | 33% | 36% |
| What stands out | Harwich Center | MA |
|---|---|---|
| Fewer adults facing food insecurity | 7.1% | 12.4% |
| Fewer adults facing housing insecurity | 6.4% | 11.1% |
| More adults who have had cancer | 15% | 8.5% |
CDC PLACES 2025 · modeled estimates for adults · CMS · HRSA
The biggest natural risk in Harwich Center is inland flooding, at a moderate overall level
FEMA puts 64% of Harwich Center’s expected hazard losses down to inland flooding, and 25% to hurricanes. 8 flood insurance claims have been paid in the town since 1991. For Harwich Center, the risk rating from FEMA is 41 of 100.
FEMA flood insurance claims · FEMA National Risk Index · OpenFEMA
A home in Harwich Center sells for about $1,000K at the median
68% of households own their home in Harwich Center.
Census ACS, 2020–24 · Zillow Home Value Index · Redfin Data Center
Everything we know about Harwich Center
SS Pendleton and 30 more within 40 miles
Museums, parks, gardens and other places to visit around Harwich Center. Close and well known come first.
 9 mi Ancient siteSS Pendleton
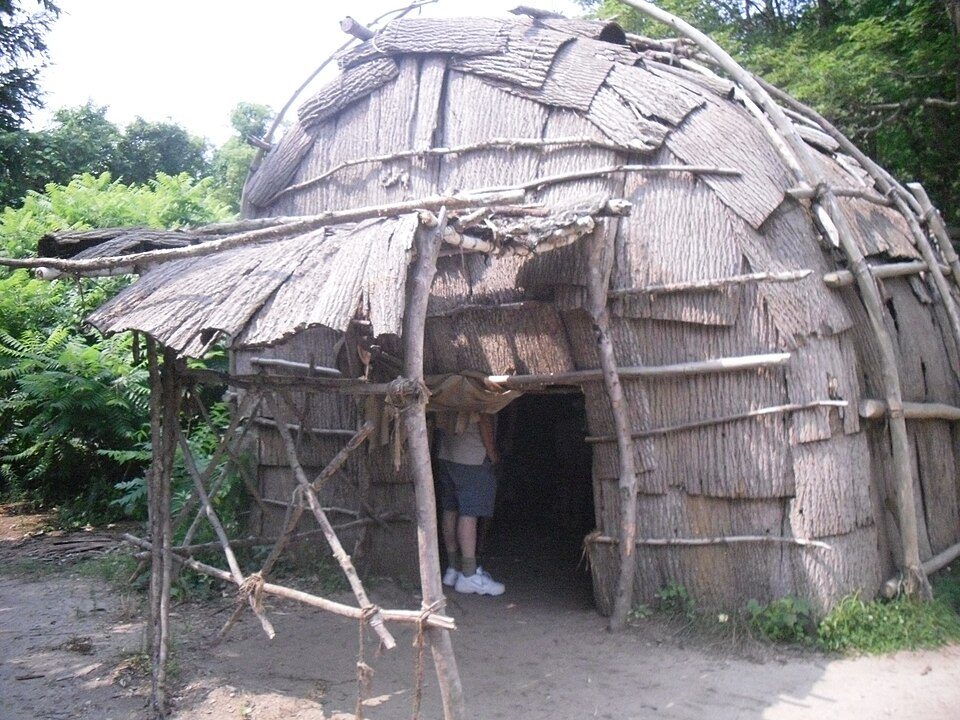 34 mi MuseumPlimoth Patuxet
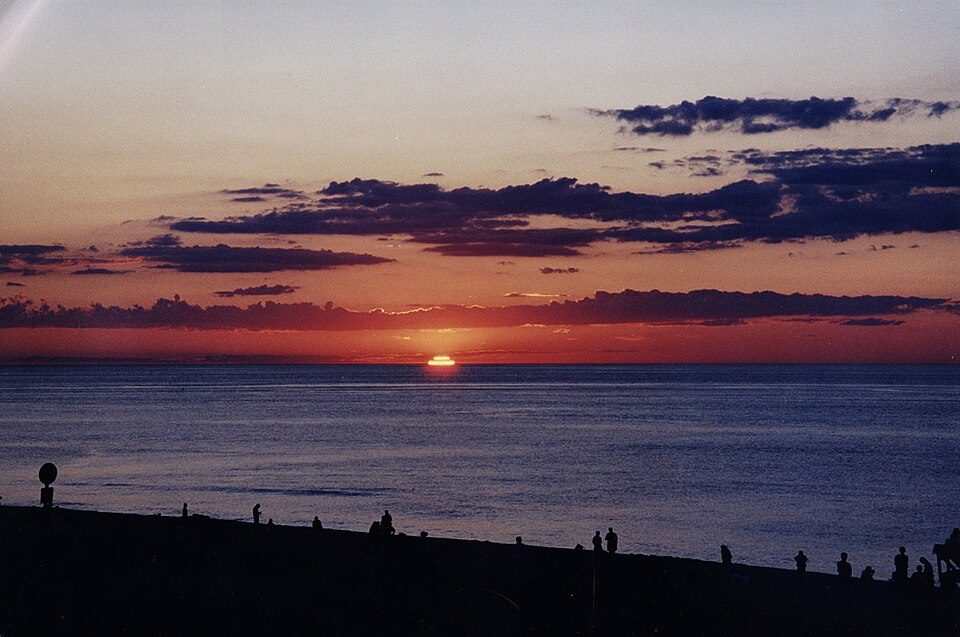 6 mi National SeashoreCape Cod National Seashore3.7M visitors a year
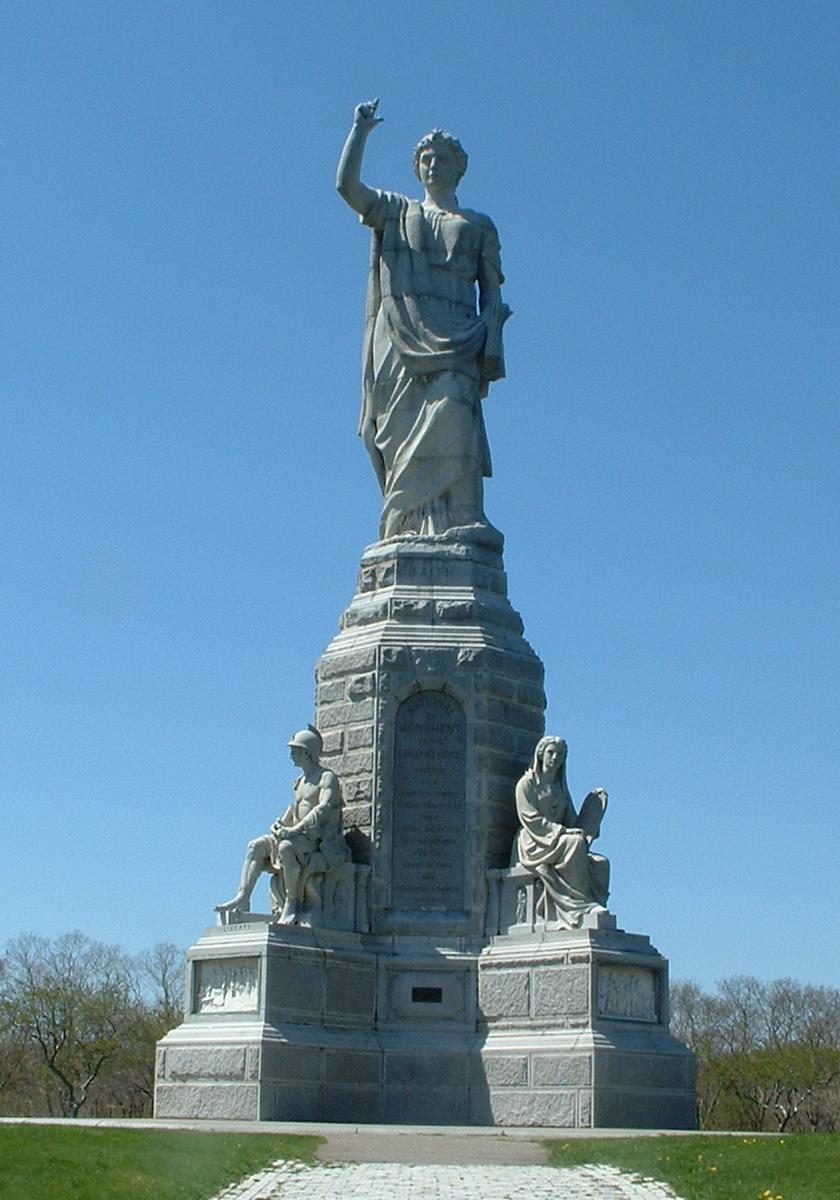 36 mi LandmarkNational Monument to the Forefathers
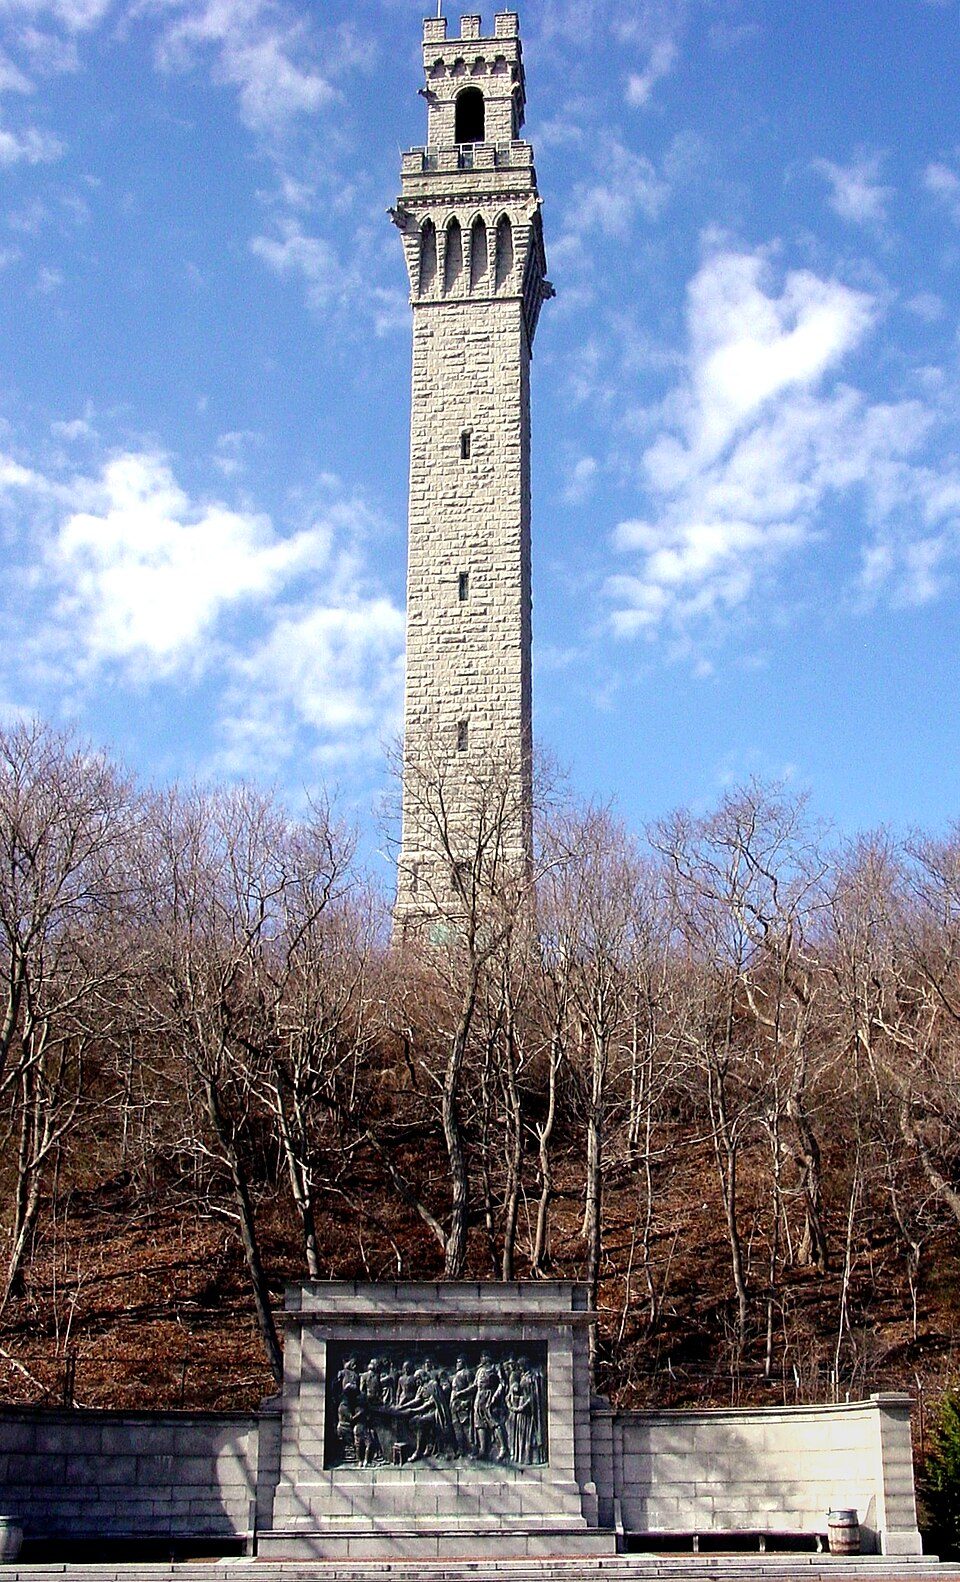 26 mi LandmarkPilgrim Monument
 9 mi MuseumElephant House
Photo credits
SS Pendleton: United States Coast Guard, Richard C. Kelsey, Public domain · Plimoth Patuxet: Tr!sie, CC BY-SA 3.0 · Cape Cod National Seashore: SeduisantRedux, CC BY 3.0 · National Monument to the Forefathers: T.S. Custadio aka ToddC4176 at en.wikipedia, Public domain · Pilgrim Monument: Peter Whitlock (Transferred by adavyd/Originally uploaded by Willster3), CC BY-SA 3.0 · Elephant House: Nicole Leigh Martel, CC BY-SA 3.0


Moving to Harwich Center: who provides what
Harwich Center is unincorporated, so Barnstable County and regional agencies provide most services.
EPA SDWIS (Oct 9, 2026) · HIFLD + EIA-861 2025 · Census 2020 ZCTAs · NCES 2024–25 · registration: vote.gov, updated Nov 18, 2024.
97% of working residents leave Harwich Center for work
Where Harwich Center’s working residents go each day. Line width shows the share.
Census LEHD 2023
Colleges nearby
1 within 15 miles of the center of Harwich Center
About 2 of every 100 Harwich Center residents are enrolled in college, against 8 across Massachusetts.
About Harwich Center
Census-designated place in Massachusetts, United States
Harwich Center is a census-designated place (CDP) in the town of Harwich in Barnstable County, Massachusetts, United States. As of the 2020 census, Harwich Center had a population of 1,995.
From Wikipedia, licensed CC BY-SA 4.0 · facts via Wikidata (CC0)
- Area
- 2.3 sq mi
Harwich Center’s neighbors
3 towns share a border with Harwich Center.
| Town | MA rank | Overall | Cost | Safety | Schools | Health |
|---|---|---|---|---|---|---|
| Harwich Center | — | — | — | — | — | — |
| East Harwich | — | — | — | — | — | — |
| Northwest Harwich | — | — | — | — | — | — |
| Harwich Port | — | — | — | — | — | — |
Harwich Center, East Harwich, Northwest Harwich and Harwich Port aren’t graded (fewer than 1,000 residents, or not enough data). Compare Harwich Center with a neighbor →
Questions about Harwich Center
Short answers, built from the data on this page.
Is Harwich Center, MA a good place to live?
We don’t grade Harwich Center yet; the figures below are still real.
Say something about Harwich Center.
Ask a question, answer one, post a photo or an event. Free, and the parts only a neighbor would know are the parts worth reading.