East HarwichMA
A town of 5,654, settled in 1830.
Is East Harwich a good place to live?
35% of residents are 65 or older in East Harwich, above both the Massachusetts town median (19%) and the median of U.S. towns (18%). Only 4 of the 284 Massachusetts towns we compare have a higher median age than East Harwich. East Harwich’s trail density is 3.6 miles per square mile, where Massachusetts’ towns sit at 1.8 and U.S. towns at 0.4. The biggest place to walk is Hawksnest State Park, 229 acres with 3 miles of trail. We don’t grade East Harwich yet; the figures below are still real.
94% of working residents leave East Harwich for work
Where East Harwich’s working residents go each day. Line width shows the share.
Census LEHD 2023
SS Pendleton and 30 more within 40 miles
Museums, parks, gardens and other places to visit around East Harwich. Close and well known come first.
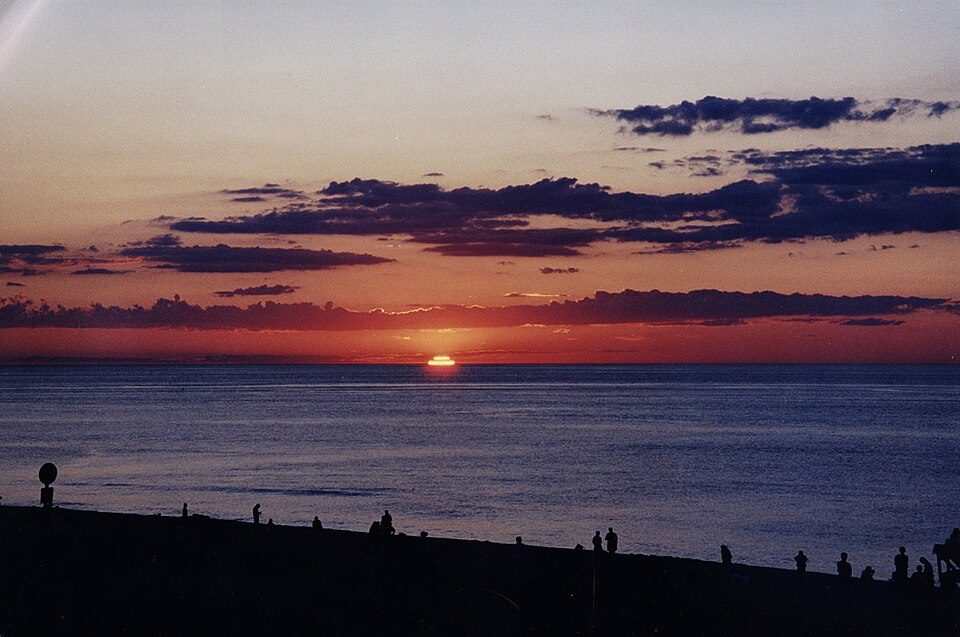
 9 mi Ancient siteSS Pendleton
 5 mi National SeashoreCape Cod National Seashore3.7M visitors a year
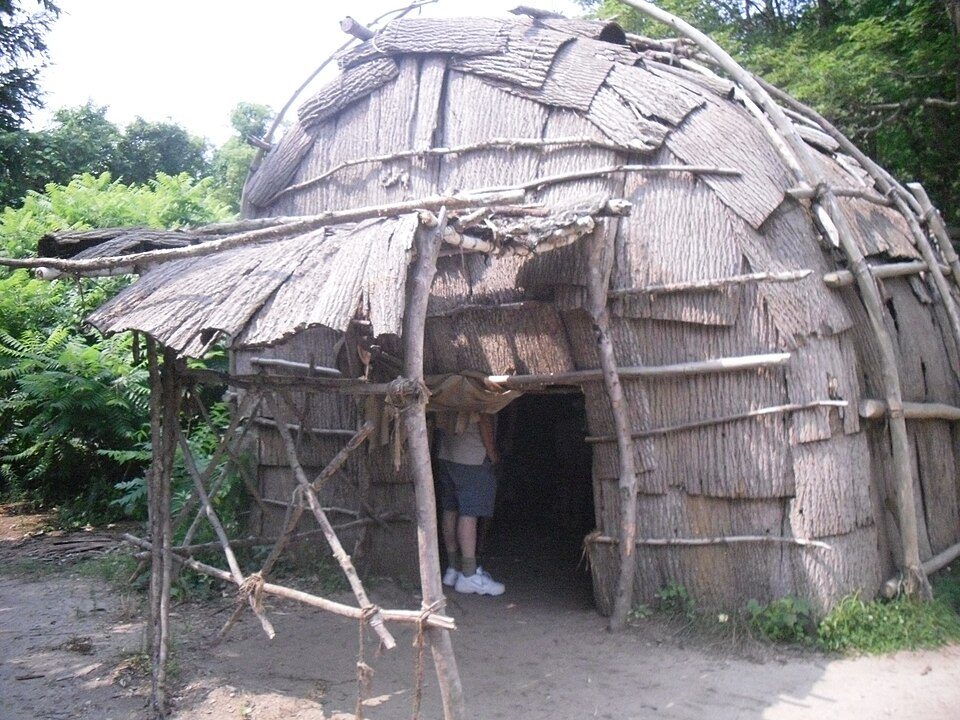 35 mi MuseumPlimoth Patuxet
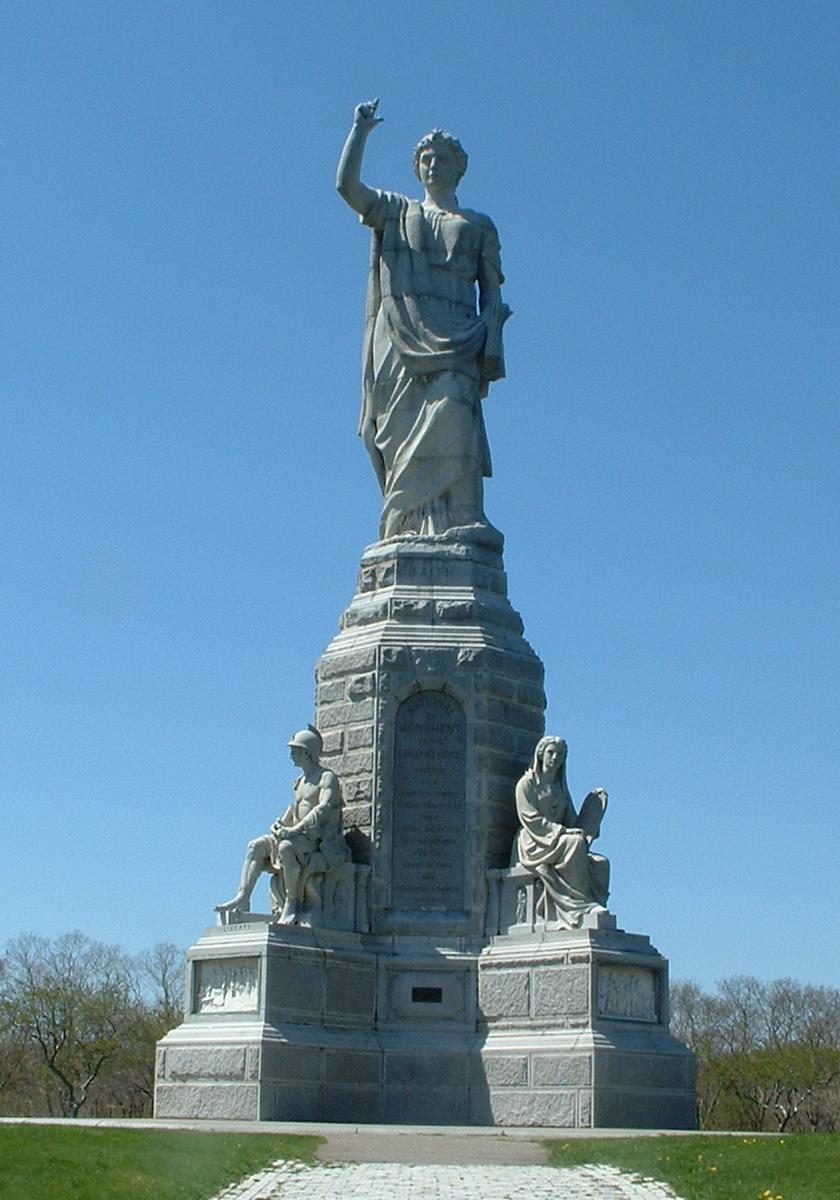 37 mi LandmarkNational Monument to the Forefathers
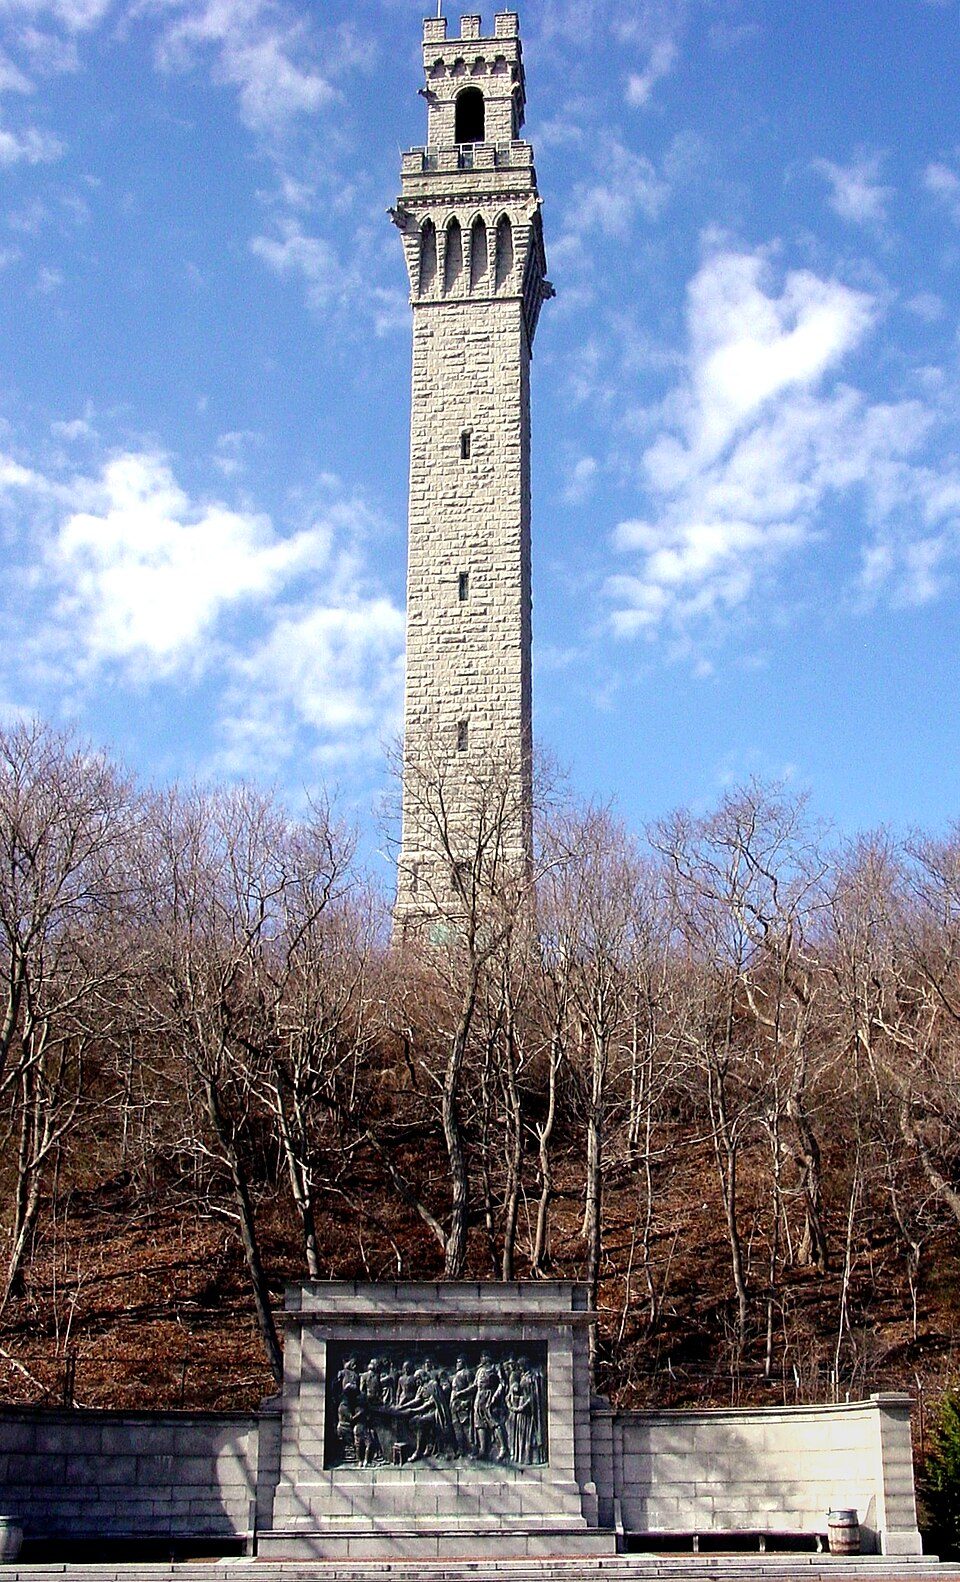 25 mi LandmarkPilgrim Monument
 11 mi MuseumElephant House
Photo credits
SS Pendleton: United States Coast Guard, Richard C. Kelsey, Public domain · Cape Cod National Seashore: SeduisantRedux, CC BY 3.0 · Plimoth Patuxet: Tr!sie, CC BY-SA 3.0 · National Monument to the Forefathers: T.S. Custadio aka ToddC4176 at en.wikipedia, Public domain · Pilgrim Monument: Peter Whitlock (Transferred by adavyd/Originally uploaded by Willster3), CC BY-SA 3.0 · Elephant House: Nicole Leigh Martel, CC BY-SA 3.0


Moving to East Harwich: who provides what
East Harwich is unincorporated, so Barnstable County and regional agencies provide most services.
EPA SDWIS (Oct 9, 2026) · HIFLD + EIA-861 2025 · Census 2020 ZCTAs · NCES 2024–25 · registration: vote.gov, updated Nov 18, 2024.
The data
Ordered by what stands out in East Harwich.
Older than Massachusetts overall
People 65 and older are 35% of residents (18% statewide); adults 18 to 34 are 12% of residents (24% statewide). 13% of residents are under 18 in East Harwich. 48% of adults 25 and older have a bachelor’s degree or more, vs 47% across Massachusetts.
| East Harwich | Massachusetts towns | U.S. towns | |
|---|---|---|---|
| Under 18 | 13% | 20% | 22% |
| Bachelor’s degree or more, 25+ | 48% | 47% | 29% |
Ages · share of residents
Education · adults 25 and older
Women and men · all residents
50% women, 50% men
That’s an even split within the survey’s margin of ±6.1 points. Across Massachusetts, 51.1% of residents are women. Among residents 18 to 24, 100% are men (MA 49%).
| East Harwich | MA | U.S. | |
|---|---|---|---|
| Under 10 | 6.8% | 10.2% | 11.6% |
| 10 to 17 | 6% | 9.2% | 10.3% |
| 18 to 24 | 3.7% | 9.8% | 9.1% |
| 25 to 34 | 8.2% | 14% | 13.7% |
| 35 to 44 | 9.3% | 13% | 13.2% |
| 45 to 54 | 4.5% | 12.3% | 12.2% |
| 55 to 64 | 26.4% | 13.6% | 12.7% |
| 65 to 74 | 23.1% | 10.5% | 10.2% |
| 75 and older | 12% | 7.4% | 7% |
| No diploma | 0.7% | 8.6% | 10.4% |
| High school | 24.3% | 22.6% | 26% |
| Some college | 19.6% | 14.1% | 19.1% |
| Associate’s | 7.9% | 7.5% | 8.8% |
| Bachelor’s | 24% | 25.5% | 21.6% |
| Graduate | 23.5% | 21.8% | 14.1% |
U.S. Census Bureau · ACS 2020-2024 5-year estimates
A smaller share of residents live below the poverty line in East Harwich than in most of Massachusetts or the rest of the country
1.7% of East Harwich residents live below the poverty line. Since 2013, East Harwich has added 286 jobs, to 1,168 in 2023. The median household income in East Harwich is $112,000.
| East Harwich | Massachusetts towns | U.S. towns | |
|---|---|---|---|
| Below the poverty line | 1.7% | 6% | 9.6% |
| Average trip to work | 24 minutes | 30 minutes | 25 minutes |
| Median household income | $112,000 | $120,000 | $80,000 |
| Working residents who work in town | 5.6% | 9.8% | 8% |
Where working residents work
Census LEHD 2023 · ACS
East Harwich has set aside 18% of its land for conservation
31 miles of trail in 25 parks and preserves.
| Biggest places to walk | Trails | Acres |
|---|---|---|
| 1. Hawksnest State Park | 3 mi | 229 |
| 2. Thompson's Field Conservation Area | 2.8 mi | 64 |
| 3. Harwich Conservation Trust Conservation Restriction | 1.6 mi | 58 |
Trails & parks © OpenStreetMap contributors · Conserved land: USGS PAD-US
A typical July afternoon in East Harwich is cooler than in the typical Massachusetts or U.S. town
East Harwich’s July high is 77°F. East Harwich has chilly winters and pleasant summers.
Typical low → high °F
NOAA U.S. Climate Normals, 1991–2020
How healthy East Harwich is
East Harwich beats the Massachusetts average on 14 of 32 CDC measures and trails it on 6.
| East Harwich | Massachusetts towns | U.S. towns | |
|---|---|---|---|
| Yearly checkup (CDC PLACES) | 85% | 82% | 79% |
| Frequent mental distress (CDC PLACES) | 14% | 16% | 17% |
| Sleep under 7 hours (CDC PLACES) | 30% | 33% | 36% |
| Binge drink (CDC PLACES) | 14% | 17% | 16% |
| What stands out | East Harwich | MA |
|---|---|---|
| Fewer adults facing food insecurity | 7.4% | 12.4% |
| Fewer adults facing housing insecurity | 6.8% | 11.1% |
| More adults who have had cancer | 13.3% | 8.5% |
CDC PLACES 2025 · modeled estimates for adults · CMS · HRSA
Zillow Home Value Index · Redfin Data Center
Inland flooding leads a moderate hazard risk in East Harwich
Expected storm and flood damage is higher than in 50% of U.S. communities. Since 1991, 9 flood insurance claims have been paid out in East Harwich.
FEMA flood insurance claims · FEMA National Risk Index · OpenFEMA
Everything we know about East Harwich
Colleges nearby
None within 15 miles of East Harwich; the nearest are
About 3 of every 100 East Harwich residents are enrolled in college, against 8 across Massachusetts.
East Harwich’s neighbors
7 towns share a border with East Harwich.
| Town | MA rank | Overall | Cost | Safety | Schools | Health |
|---|---|---|---|---|---|---|
| East Harwich | — | — | — | — | — | — |
| Harwich | #155 | B | D | A− | B | A |
| Harwich Center | — | — | — | — | — | — |
| Brewster | #136 | B+ | D | A− | B | A |
| Chatham | #141 | B+ | D | A− | B | A |
| Northwest Harwich | — | — | — | — | — | — |
| Harwich Port | — | — | — | — | — | — |
| Orleans | #145 | B+ | D | B | B+ | A |
East Harwich, Harwich Center, Northwest Harwich and Harwich Port aren’t graded (fewer than 1,000 residents, or not enough data). Compare East Harwich with a neighbor →
Questions about East Harwich
Short answers, built from the data on this page.
Is East Harwich, MA a good place to live?
We don’t grade East Harwich yet; the figures below are still real.