Guest, Sign inJoin

Post to Belmont

We’ll email a one-tap link to publish your post. No password, and nothing is public until you click it.
Already a member? Sign in
Looking north on Leonard Street, Belmont Center MA
Massachusetts›Middlesex County
Photo: John Phelan · CC BY 3.0
Photo of Belmont

Belmont, MA · Photo: John Phelan · CC BY 3.0 · Source ↗

Why does Belmont grade so well?

Because it does well by almost any measure. Belmont earns an A+, 33rd of 282 graded towns in Massachusetts. It is among the healthiest towns in the country on CDC estimates, its schools outperform 96% of the state's, and the median household earns $183K. The exception is cost of living: the typical home is worth about $1.4 million, 12.3 years of the Boston metro’s $116K median household income. History is its standout character grade: an A, better than 94% of U.S. towns, with 6 places on the National Register. 81% of adults 25 and older hold a bachelor’s degree or more in Belmont, against 47% in Massachusetts’ towns and 29% across U.S. towns. Belmont is among the most walkable places in the country. Its National Register listings include Red Top and McLean Hospital National Register District.

What makes Belmont stand out

Where Belmont beats most towns.

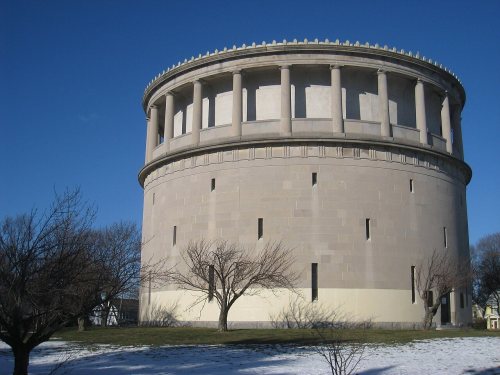
Red Top
Red Top · National Register of Historic Places
Belmont’s story

390 years in pictures

Red Top is a National Historic Landmark, the National Register’s top tier.

Census counts: 1,198 in 1860, 27,295 in 2020. The archive holds 24 old photos and papers going back to 1725 and 6 maps from 1893 on.

6 places on the National Register of Historic Places.

  • 1636Belmont is settled
Explore the history →

How Belmont grades

Each subject compared with towns across the country (schools within Massachusetts), ordered by how far Belmont is from typical.

How grading works

Character Graded, but not part of the overall grade.
Described, not graded Taste, not quality: snow or an older crowd is neither good nor bad.

How TownRatings grades towns →

Nearby attractions

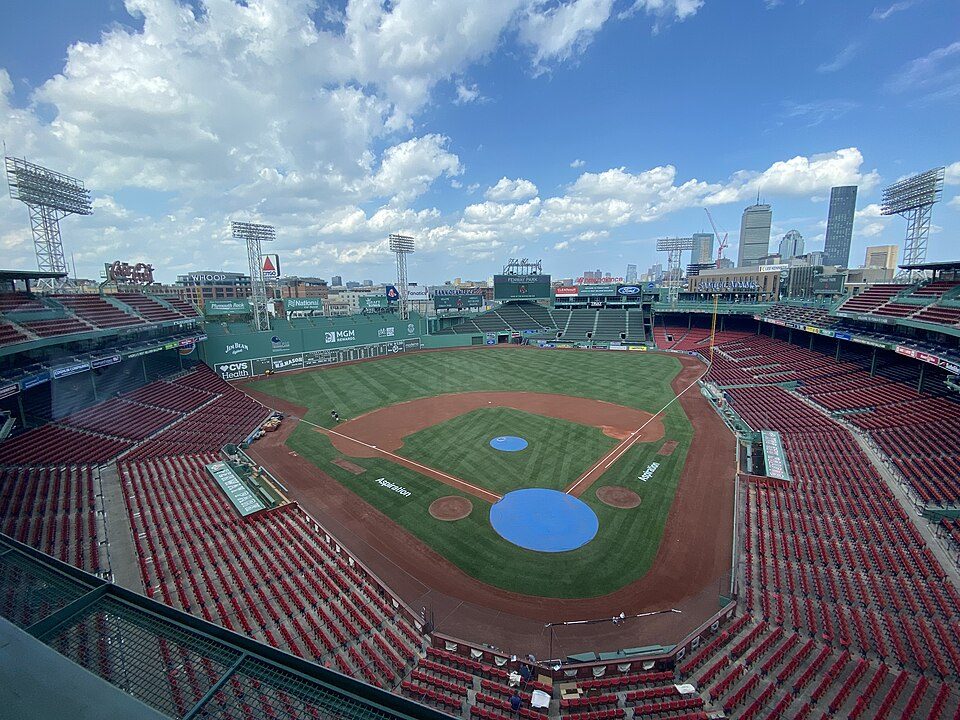
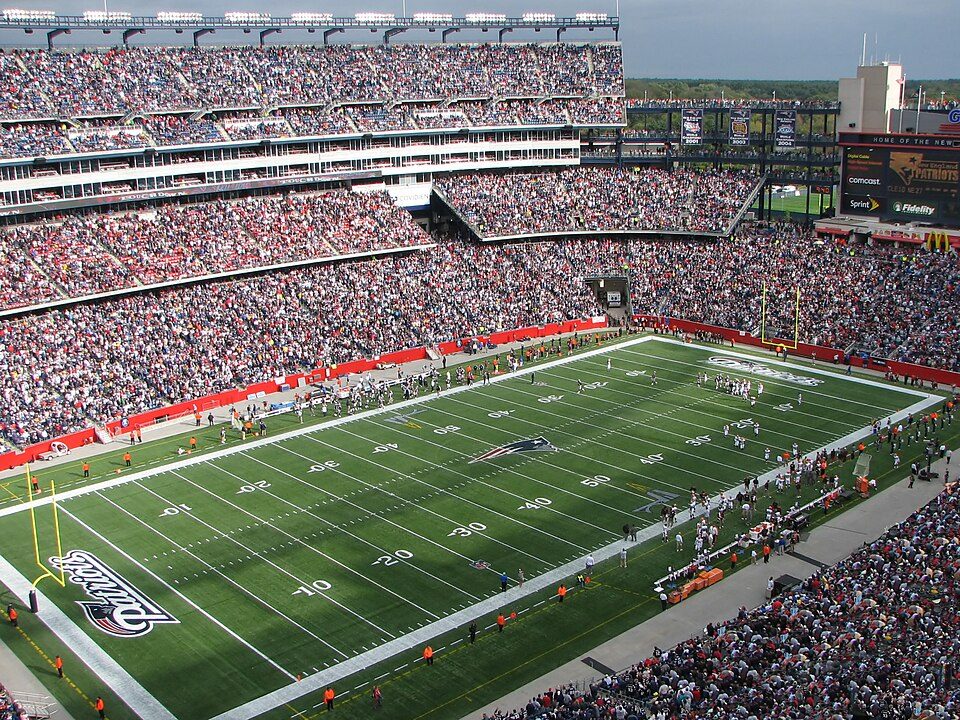
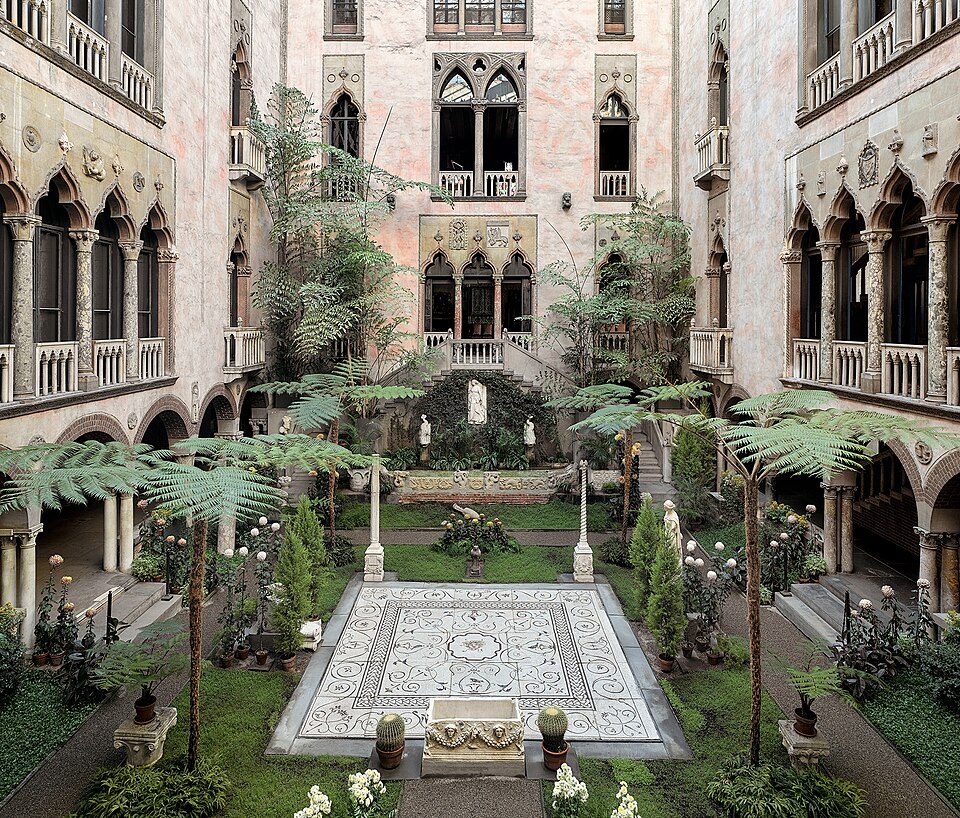
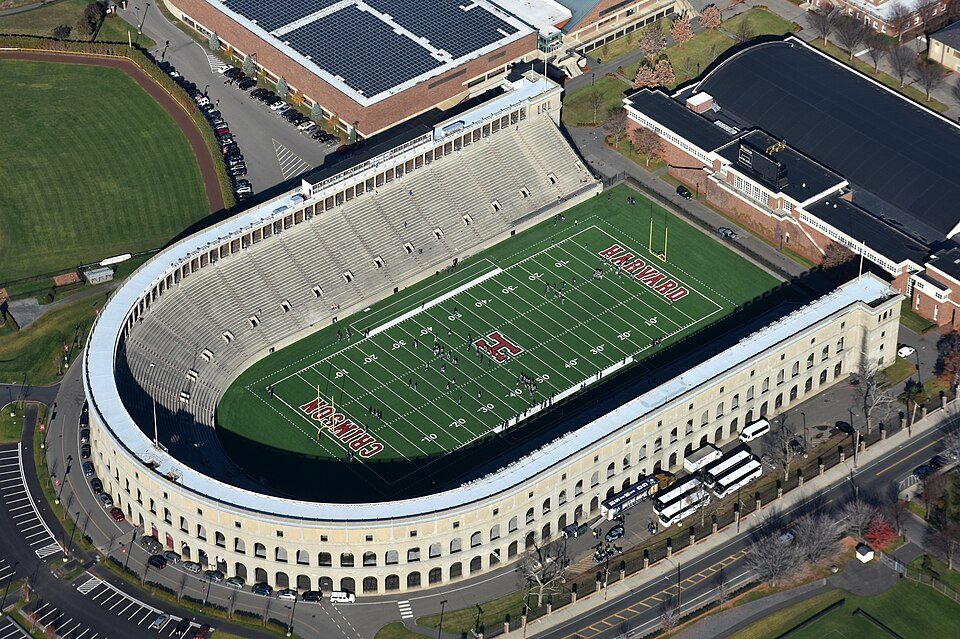
Fenway Park and 180 more within 40 miles

Museums, parks, gardens and other places to visit around Belmont. Close and well known come first.

All 242 attractions →
Sources: National Park Service · ski areas © OpenSkiMap / OpenStreetMap contributors · Wikidata · Wikipedia readership · photos via Wikimedia Commons
Photo credits

Fenway Park: Gatorfan252525, CC BY-SA 4.0 · Gillette Stadium: Bernard Gagnon, CC BY-SA 3.0 · Isabella Stewart Gardner Museum: Sean Dungan, CC BY-SA 4.0 · Harvard Stadium: Nick Allen, CC BY-SA 4.0 · Walden Pond: Victorgrigas, CC BY-SA 3.0 · Freedom Trail: Ingfbruno, CC BY-SA 3.0

Getting set up

Moving to Belmont: who provides what

Who provides power, water and the rest in Belmont, and how to reach them.

The full setup list →
PowerTown of BelmontEIAHIFLD · EIA
WaterBelmont Water Dept. (Mwra)No health-based violations in 5 years · EPAEPA
Internet5 providers100% of addresses get 100/20 MbpsFCC
Trash & dumpF.W. RussellTrash haulerTown site
SchoolsBelmont School DistrictWhich school depends on your addressNCES
Register to voteOnlineIn Massachusetts you can register online until 10 days before Election Day, in person until 10 days before Election Day, or by mail (postmarked 10 days before).vote.gov
Who runs elections hereBelmont Town ClerkThe town itself; contacts on the Handbook page.FVAP, Jun 2023
ZIP code0247802478 100%Census 2020

EPA SDWIS (Oct 9, 2026) · HIFLD + EIA-861 2025 · Census 2020 ZCTAs · NCES 2024–25 · registration: vote.gov, updated Nov 18, 2024.

The data

Ordered by what stands out in Belmont.

Belmont has schools in the top 5% of Massachusetts and is safe by national standards but not by Massachusetts’s; it also has homes that cost more against local pay than most of Massachusetts.

HousingCost of living grade D−

Belmont earns a D− for cost of living

At 12.3 years of the Boston metro’s $116K median household income, the typical home (about $1.42M) costs more against local pay than in 95% of Massachusetts towns; that ratio is one input to that grade.

Nearly two thirds of Belmont households live in a home they own. A typical home here is worth about $1,421,000, up 1.4% in a year, about twice the Massachusetts typical home. Its median rent stands at $2,527 a month.

$1.42MZillow home value
BelmontMassachusetts townsU.S. towns
Median rent$2,527 a month$1,682 a month$1,185 a month
Households that own their home65%79%73%

Typical home value

Belmont$1.42M
Massachusetts$655K
Market temperature
BalancedA seller's marketBuyer’sSeller’s
15
days on market
102.4%
sale-to-list price
+1.4%
value change, 1 year
18
homes sold in May

Census ACS, 2020–24 · Zillow Home Value Index · Redfin Data Center

SchoolsA+

Belmont earns an A+ for schools

That grade ranks #9 of the 283 Massachusetts towns we grade for schools. It comes with a D− for cost of living: the typical home is worth about $1.42M.

Its public schools are run by the Belmont school district. Of its 10 schools, three are listed below, each with the reason. The 4 public schools in Belmont teach 1,229 students between them.

96%of MA districts it outscoresA+School Grade
SchoolLevelStudentsLetter
Winthrop L Chenery Upper ElementaryLargest public middle schoolGrades 4–6Grades 4–61,023A
Belmont HighLargest public high schoolGrades 9–12Grades 9–121,454A+
Winn BrookTop results in townGrades K–3Grades K–3304A+

NCES · EDFacts · graded within MA on state tests and graduation

OutdoorsA+

Belmont keeps 16.5% of its land conserved

Lone Tree Conservation Area, at 97 acres with 3.6 miles of trail, is the biggest park or preserve. 16 miles of trail in 14 parks and preserves. The density of trails for Belmont comes to 3.5 miles per square mile.

#37for trails in MA
16.5%
conserved · 495 of 3,001 acres
16 mi
of trails · 3.5 per sq mi
Biggest places to walkTrailsAcres
1. Lone Tree Conservation Area3.6 mi97
2. Habitat Education Center & Wildlife Sanctuary3.6 mi81
3. Rock Meadow Conservation Area1.6 mi71

Trails & parks © OpenStreetMap contributors · Conserved land: USGS PAD-US

HealthA+

Compared with most of Massachusetts and the rest of the country, fewer of Belmont’s adults report frequent physical distress

Its widest gap with Massachusetts is tooth loss: 5% of those 65+ have lost all their teeth, against 11.9% statewide.

Among adults in Belmont, 15% get no exercise outside work. Only 10 of the 279 Massachusetts towns we compare have a lower share of adults who have high blood pressure than Belmont.

99%healthier than U.S. townsA+Health Grade
BelmontMassachusetts townsU.S. towns
Frequent physical distress (CDC PLACES)8.6%12%14%
Obesity (CDC PLACES)21%28%35%
Frequent mental distress (CDC PLACES)12%16%17%
Smoke cigarettes (CDC PLACES)6.6%11%14%
32 measures vs. Massachusetts
23 better9 too close to call0 worse
What stands outBelmontMA
Fewer older adults who have lost all their teeth5%11.9%
Fewer uninsured adults2.4%5.2%
Mount Auburn Hospital
2.9 mi away · emergency room
None
primary care, dental or mental-health shortage
98th
percentile among MA towns

CDC PLACES 2025 · modeled estimates for adults · CMS · HRSA

SafetyA−

Belmont reports less crime per resident than three in four U.S. towns

At 9.6 crimes per 1,000 residents a year, it reports less crime than 59% of Massachusetts’s graded towns. Violent crime is rare: 8 reported in 2025, 0.3 per 1,000 residents.

Belmont’s level of violent crime is 0.3 per 1,000 residents. Its level of property crime stands at 7.9 per 1,000 residents.

76%of U.S. towns report more crimeA−Safety Grade
BelmontMassachusetts townsU.S. towns
Violent crimes per 1,000 (2025)0.3 per 1,000 residents1.51.6
Property crimes per 1,000 (2025)7.9 per 1,000 residents4.99.9

Violent crime per 1,000 residents

Belmont0.3
Massachusetts3
U.S.3.3

Property crime per 1,000 residents

Belmont7.9
Massachusetts10.4
U.S.15.5
76th
percentile among U.S. towns we grade
59th
percentile among MA towns
8
violent crimes reported in 2025
216
property crimes reported in 2025

FBI crime data, 2025 · crimes reported to police

Work & commuteJobs & income grade A

With 0.5 jobs for every working resident, most of Belmont’s workers commute out

31.5% of workers work from home, against 18.6% across Massachusetts.

Only 7% of working residents stay in Belmont for work; the rest commute out. In Belmont, nearly a third of workers do their job from home. Half of commuters travel less than 6 miles. Employers in Belmont added 626 jobs between 2013 and 2023, to 7,243.

7%work in town
BelmontMassachusetts townsU.S. towns
Work from home32%18%11%
Median household income$183,000$120,000$80,000
Below the poverty line3.6%6%9.6%
Average trip to work29 minutes30 minutes25 minutes

Where working residents work

In Belmont7%
Boston28%
Cambridge19%
Waltham5%
Lexington3%
6 mi
median commute distance
7,243
jobs based in Belmont
A commuter town
jobs vs. working residents
A+
Walkability grade: among the most walkable U.S. towns

Census LEHD 2023 · ACS

Climate

Expect snowy winters and pleasant summers in Belmont

In July, afternoons reach 84°; in January, nights fall to 19°, and about 64 inches of snow falls in a winter.

64″snow a winter

Typical low → high °F

Winter21–39°
Spring37–58°
Summer60–81°
Fall42–63°
Oct 17
typical first frost
Apr 25
typical last frost
+2.0°
vs. the 20th-century average

NOAA U.S. Climate Normals, 1991–2020

Natural hazardsHazard risk grade B

Low risk in Belmont, with inland flooding at the top

18 flood insurance claims have been paid in Belmont since 1978. Storm and flood damage is expected to run lower than in 63% of U.S. communities. Expected losses in Belmont break down as 74% from inland flooding and 8% from hurricanes. Households locally have drawn federal disaster aid in 12 declared disasters, most recently in 2018.

37risk score of 100
FEMA risk score
37Low riskLowerHigher
Inland floodingHurricanesEarthquakes
18
paid flood claims since 1978
12
federal disasters paid out here

FEMA flood insurance claims · FEMA disaster declarations and aid · FEMA National Risk Index · OpenFEMA

Keep exploring

Everything we know about Belmont

20pages on Belmont
After high school

Colleges nearby

52 within 15 miles of the center of Belmont

A growing town

Belmont has grown 10% since 2010

24,729 counted in 2010 and 27,295 in 2020; an estimated 27,118 in 2025.

Growth has leveled off: within 1% of 2020, after 10.4% in the decade before.

24,7292010
27,2952020
27,1182025 est.

U.S. Census 2010 & 2020 counts · Census Bureau estimate, July 1, 2025

Landmarks

6 places in Belmont on the National Register of Historic Places.

All landmarks →

Famous people from Belmont

31 notable people were born in Belmont.

See all 31 →

About Belmont

Town in Massachusetts, United States

Official town website ↗

Belmont is a town in Middlesex County, Massachusetts, United States. It is a western suburb of Boston and is part of the Greater Boston metropolitan area. As of the 2020 U.S. census, its population was 27,295, an increase of 10.4% from 2010.

From Wikipedia, licensed CC BY-SA 4.0 · facts via Wikidata (CC0)

Established
1636
Area
4.7 sq mi
Elevation
43 ft
ZIP code
02478

Belmont’s neighbors

5 towns share a border with Belmont.

Explore the map →
How the neighbors grade
TownMA rankOverallCostSafetySchoolsHealth
Belmont#33A+D−A−A+A+
Waltham#187B−DB−CA
Arlington#29A+DA−AA+
Cambridge#190B−D−DBA+
Watertown#225C+DC+B−—
Lexington#10A+DAA+A+

Compare Belmont with a neighbor →

Questions about Belmont

Short answers, built from the data on this page.

Is Belmont, MA a good place to live?

Yes, by almost any measure. Belmont grades A+ overall, better than 97% of U.S. towns and #33 of 282 in Massachusetts. It grades A+ for health, A− for safety and A+ for schools. Cost of living is its weak spot, with a D−.

Is Belmont, MA expensive?

Yes. Cost of living, which also weighs rents, property taxes and how many households pay 30% or more of their income for housing, grades D−.

What is Belmont, MA known for?

31 notable people were born here, including Jean Rogers and Sebastian Junger.