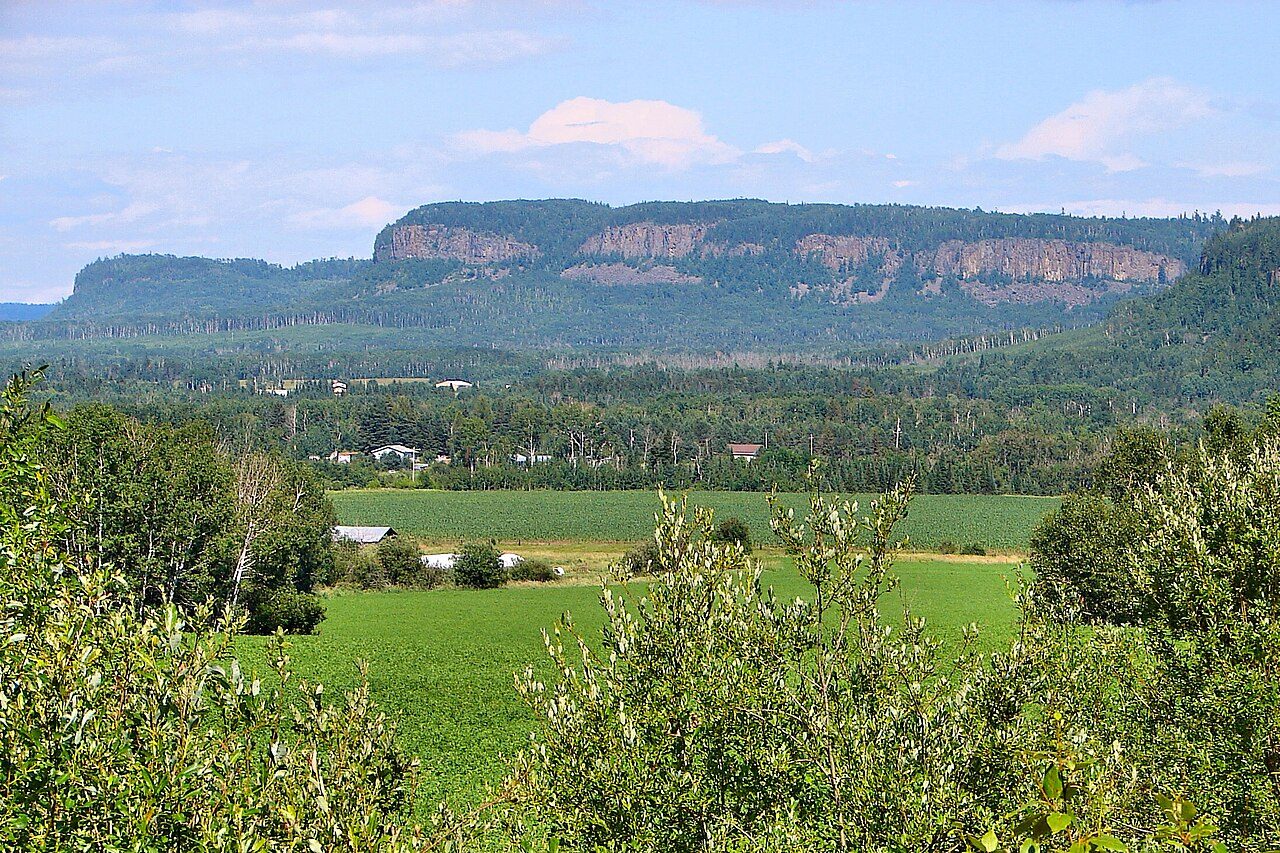
 Photo: P199 · CC BY-SA 3.0
Per resident, Neebing spends less than 97% of Ontario’s single-tier municipalities
Voters in Neebing chose Mark Roger Thibert as mayor in October 2022, for a 7-seat council. The council shown is the one elected in 2022, since Ontario voted again on 26 October 2026 and no open file of the new councils exists yet. Neebing sends one MP to Ottawa from Thunder Bay—Rainy River, its riding (a federal electoral district, which elects one MP): Marcus Powlowski (Liberal Party of Canada). No provincial riding is named for Neebing: northern Ontario’s ridings for the Legislative Assembly of Ontario have no open boundaries.
What stands out in how Neebing is governed
Few residents per seat
Across Ontario the median is one seat per 1,540 residents, above the ratio on Neebing council. Council size ↓
Turnout below the norm
The 2022 vote for Neebing council drew fewer electors than Ontario’s median of 35%. How Neebing voted ↓
Low spending per resident
Most of Ontario’s single-tier municipalities spent more per resident in 2024 than Neebing council: 97% of them. Council money ↓
A close federal race
The 2021 winner in Thunder Bay—Rainy River finished 5 points ahead of the runner-up (Conservative Party of Canada), a closer race than 87% of Canada’s 338 ridings. How Neebing has voted ↓
Compared with the province’s municipalities of 1,000+ residents (2021 Census; MAMH, MMAH and Statistics Canada).
Three governments, and who does what
Neebing, a municipality in Ontario, shares the work with the province and Ottawa.
Local services, by-laws and property tax.
Schools, health care, highways, municipal law.
ola.org ↗Passports, pensions, EI, defence, immigration.
ourcommons.ca ↗Who to ask
Green: municipal. Gold: provincial. Grey: federal.
Neebing is a single-tier municipality: no county or region sits above its council, though Statistics Canada still counts it in the Thunder Bay census division.
From the council table to Ottawa
Every elected tier that speaks for Neebing, from the most recent elections.
- 1Neebing councilelected October 2022Mark Roger Thibert
- 2Legislative Assembly of Ontario–
- 3House of CommonsThunder Bay—Rainy River
Party colours are neutral on purpose: they tell parties apart and aren’t the parties’ own. MPs: Wikidata (CC0), 45th Parliament statements, read 7 November 2026; ridings: 2023 Representation Order, Statistics Canada
Who was elected to Neebing council in 2022
Everyone elected in 2022, with their votes; Ontario’s file gives each seat’s votes but not the ward’s name.
- Mark Roger Thibert
- Curtis Coulson
- Gordon Cuthbertson
- Gary Gardner
- Brian Kurikka
- Katherine Hill
- Obie Egbuchulam
7 members and how they were elected
| Name | Seat | Votes | Share of the seat’s votes | On the last council |
|---|---|---|---|---|
| Mark Roger Thibert | Mayor | 437 | 63% | Yes |
| Curtis Coulson | Councillor | – | acclaimed | Yes |
| Gordon Cuthbertson | Councillor | 370 | 55% | Yes |
| Gary Gardner | Councillor | – | acclaimed | Yes |
| Brian Kurikka | Councillor | – | acclaimed | Yes |
| Katherine Hill | Councillor | 173 | 56% | No |
| Obie Egbuchulam | Councillor | 79 | 50% | No |
Councillors on Neebing council are elected by ward, the mayor by the whole municipality. Mark Roger Thibert became mayor on 63% of the votes cast.
Councils: Ontario 2022 Municipal Election data, MMAH (OGL-Ontario)
Neebing voted less than most of Ontario in 2022
Turnout in the October 2022 municipal elections, beside nearby municipalities; the tick is Ontario’s median.
On 24 October 2022, only 26% of electors voted for Neebing council, a weaker showing than most of Ontario. No closer places have figures: these lie 25–51 km from Neebing.
How Neebing voted: same source as Councillors, above.
When Neebing votes
The last and next general elections at each level; a by-election can come in between.
| Election | Last | Next |
|---|---|---|
| Neebing council | 26 October 2026 | 28 October 2030 |
| Legislative Assembly of Ontario | 27 February 2025 | – |
| House of Commons | 28 April 2025 | – |
The latest vote shown is 2021: the 2025 counts carry Elections Canada’s non-commercial terms. Neebing votes next on 28 October 2030: the Municipal Elections Act, 1996 sets municipal elections on the fourth Monday in October every four years. Voters last chose the Legislative Assembly of Ontario on 27 February 2025 and the House of Commons on 28 April 2025.
Election dates: the legislatures, MMAH and MAMH
The Legislative Assembly of Ontario: riding not placed
Provinces and territories run schools, health care and municipal law; each riding elects one MPP.
Find your MPP on the legislature’s site
ola.org ↗Legislatures: their own member pages
Marcus Powlowski represents Thunder Bay—Rainy River in Ottawa
Each riding elects one MP to the House of Commons; the general election of 28 April 2025 chose the 45th Parliament.
Thunder Bay—Rainy River · Liberal Party of Canada · first elected 2019
en.wikipedia.org ↗- Liberal Party of Canada71
- Conservative Party of Canada50
As Wikidata records them.
Marcus Powlowski’s party, the Liberal Party of Canada, has 71 of the 122 seats from Ontario.
The MP’s record
The current Parliament is Marcus Powlowski’s 3rd, counting from a first win in 2019. On today’s boundaries, the 2021 vote in Thunder Bay—Rainy River would have gone to the Liberal Party of Canada with 34%, and Marcus Powlowski kept it for them in 2025.
MPs: Wikidata (CC0), 45th Parliament statements, read 7 November 2026; ridings: 2023 Representation Order, Statistics Canada · MPs’ records: Wikidata (CC0), positions held and party memberships, read 8 November 2026
In 2021, Thunder Bay—Rainy River re-elected Marcus Powlowski of the Liberal Party of Canada
Thunder Bay—Rainy River as it stood from 2013: the 2019 and 2021 counts, before the riding was redrawn for 2025.
Thunder Bay—Rainy River turned out at only 61% in 2021; the country managed 63%. Thunder Bay—Rainy River elected Marcus Powlowski (Liberal Party of Canada) in 2021: 34% of the vote, a lead of 1,984 over Adelina Pecchia (Conservative Party of Canada). Marcus Powlowski was the sitting MP, elected there in 2019 with 35%.
All 5 candidates in Thunder Bay—Rainy River, 2021
| Candidate | Party | Votes | Share |
|---|---|---|---|
| Marcus Powlowski | Liberal Party of Canada | 13,655 | 34.3% |
| Adelina Pecchia | Conservative Party of Canada | 11,671 | 29.3% |
| Yuk-Sem Won | New Democratic Party | 11,342 | 28.5% |
| Alan Aubut | People's Party of Canada | 2,621 | 6.6% |
| Tracey MacKinnon | Green Party of Canada | 571 | 1.4% |
Federal results: Elections Canada, 43rd and 44th general elections and the 44th’s transposition to the 2023 ridings, via open.canada.ca. Contains information licensed under the Open Government Licence – Canada
Neebing council spends less per resident than most
The 2024 financial return: spending by service and revenue by source, per resident, compared only with Ontario’s single-tier municipalities.
Spending per resident by service, 2024
What pays for it
Shares of revenue, town and province.
Taxes on property make up 56% of what comes in, more than the province-wide 37%. Full-time staff number 9, about 4.0 to every thousand residents. No service costs more than roads and transit, at $824 per resident and 39% of the total. In 2024 the median among Ontario’s single-tier municipalities was $3,796 a resident; Neebing council spent $2,135.
Spending per resident nearby
Every service line, 2024
| Service | 2024 | Per resident | Share |
|---|---|---|---|
| Roads and transit | $1.8M | $824 | 39% |
| General government | $985K | $439 | 21% |
| Police, fire and protection | $727K | $324 | 15% |
| Public health and paramedics | $403K | $180 | 8% |
| Water, sewers and waste | $259K | $116 | 5% |
| Social services and child care | $257K | $115 | 5% |
| Social housing | $200K | $89 | 4% |
| Recreation and culture | $94K | $42 | 2% |
| Planning and development | $11K | $5 | 0% |
Money: Financial Information Return 2024, Ontario Ministry of Municipal Affairs and Housing. Contains information licensed under the Open Government Licence – Ontario.
One seat for every 340 residents
Residents (2021 Census) per council seat, head of council included, beside nearby municipalities; the tick is the provincial median.
At 340 residents a seat, Neebing council is more closely spread than 89% of Ontario municipalities.
Residents: 2021 Census; seats: the province’s council list
Having a say in how Neebing is run
Check or update the federal list.
elections.ca ↗Every MP lists an office.
ourcommons.ca ↗Ridings, registration and voting dates.
elections.on.ca ↗What this data can and can’t tell you
- Council money. Per resident means the 2024 Financial Information Return’s totals over the population it reports. Since a county or region spends in its lower tiers too, those are compared only with each other.
- Council size. Every seat counts, the head of council’s too, against the population of the 2021 Census.
- Which riding. Each place is put in its ridings by where its 2021 Census residents live; a riding holding 5% or more of them is listed.
- Election results. Two maps are in play: the 2013 ridings, on which 2019 and 2021 were counted, and the 2023 ridings, onto which Elections Canada transposed the 2021 vote poll by poll.
- Not on this page. Party control (most Canadian councils sit without parties, and the open lists record none) and band councils.
- Who holds each seat. MPs come from Wikidata’s records of the 45th Parliament, which can lag a resignation or a by-election by some days.
Questions about how Neebing is run
Who is the MP for Neebing?
Thunder Bay—Rainy River’s MP, Marcus Powlowski of the Liberal Party of Canada, represents Neebing.
Which party won Neebing in the 2021 federal election?
In 2021 it was Marcus Powlowski (Liberal Party of Canada), who represents Thunder Bay—Rainy River still.
Who is the MPP for Neebing?
Neebing’s riding isn’t placed on this page; the Legislative Assembly of Ontario’s members page lists every MPP by riding.
Who heads the council in Neebing?
In October 2022, Mark Roger Thibert won the post of mayor for Neebing council’s 2022–26 term.
How much does Neebing council spend?
The 2024 return of Neebing council shows $4.8M of spending for roughly 2,241 residents, $1.8M of it on roads and transit.
How is Neebing council elected?
By ward for councillors and at large for the mayor, on Neebing council.
What was the turnout in Neebing?
It was 26.1% for Neebing council in 2022, with Ontario’s municipalities at a median of 35.5%.
Sources: MPs: Wikidata (CC0), 45th Parliament statements, read 7 November 2026; ridings: 2023 Representation Order, Statistics Canada · Councils: Ontario 2022 Municipal Election data, MMAH (OGL-Ontario) · Money: Financial Information Return 2024, Ontario Ministry of Municipal Affairs and Housing. Contains information licensed under the Open Government Licence – Ontario. · Next municipal election: the province’s municipal election act · Municipality types: Statistics Canada census subdivisions · Federal results: Elections Canada, 43rd and 44th general elections and the 44th’s transposition to the 2023 ridings, via open.canada.ca. Contains information licensed under the Open Government Licence – Canada · MPs’ records: Wikidata (CC0), positions held and party memberships, read 8 November 2026. Under the Statistics Canada Open Licence.
Adapted from Statistics Canada (Census of Population 2021, population estimates 2025, 2021 census boundaries) under the Statistics Canada Open Licence; this does not constitute an endorsement by Statistics Canada. Neighbourhood names in some cities © OpenStreetMap contributors (ODbL).