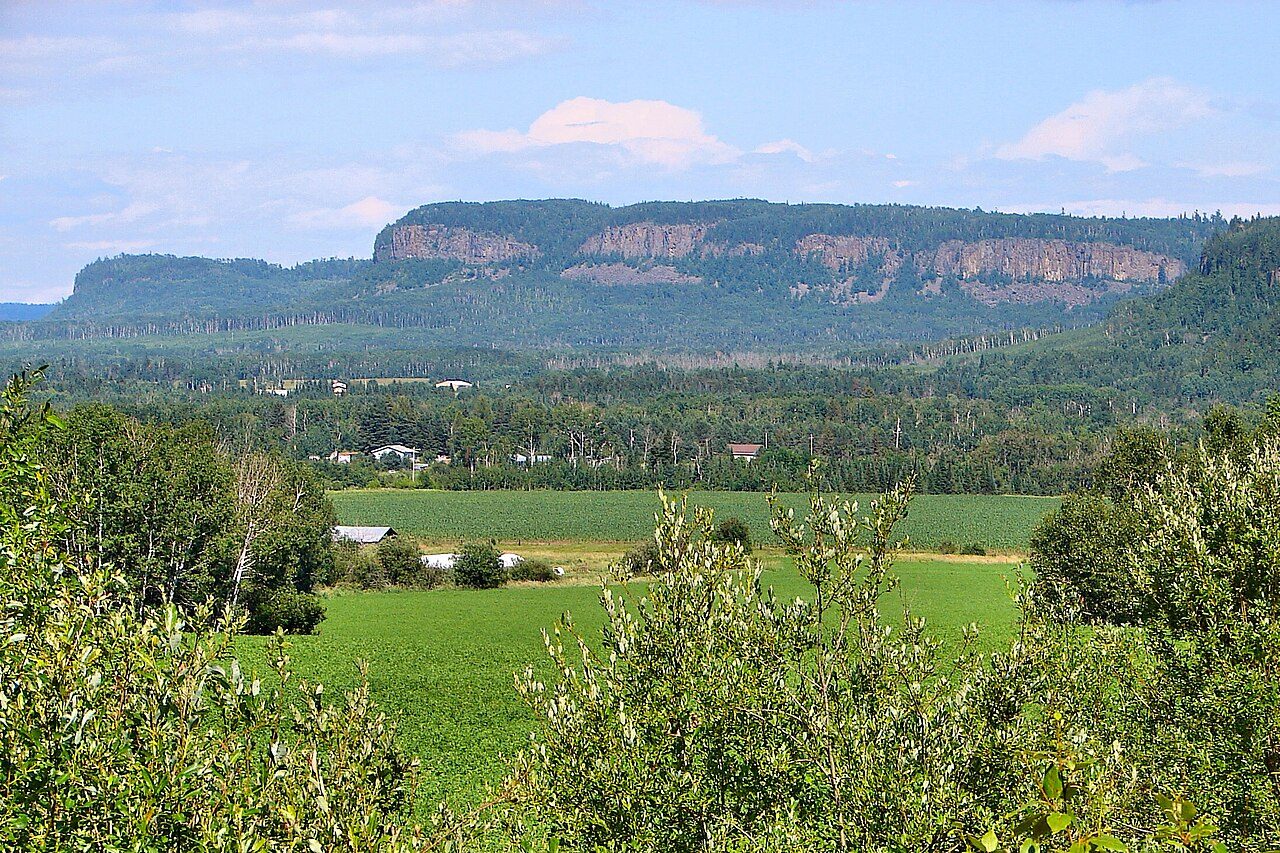
 Photo: P199 · CC BY-SA 3.0
Few Canadian towns get more frosts than Neebing
July afternoons average 24.9°C. Counting rain and snow together, it is drier than 66% of Canadian towns. Rain or snow is most frequent in July and least in February. If you like long walks, July and August offer highs of 24–25°C.
No ECCC station in Neebing has 1991–2020 normals; the page reads Thunder Bay, 23 km north-east, instead.
A year in Neebing at a glance
Each month’s typical high and low, in °C.
What stands out about Neebing’s climate
Compared with Canadian towns, with its place among towns of 2,500+ in Ontario beside it.
What a year in Neebing feels like
Each season’s and each month’s usual high and low, 1991–2020.
About 206 frosts a year
From September to May frost is routine, and in January it comes on almost every night. On about 42 nights a year the air falls below −20°C.
Frost days by month
Average days at 0°C or below
Rain and melted snow: about 790 mm a year
Some 110 days a year see 1 mm of rain or snow or more.
Rain and snow by month
Millimetres
Thunder Bay publishes no full year of precipitation, so these figures come from Atikokan, 167 km away.
Living with Neebing’s climate
What the normals mean for a garden, a day outside and the depth of winter.
The outdoor season by the averages is Jul and Aug, with highs of 17–27°C and lows of 8°C or more.
Parks & trails →About 68 days a year bring a wind chill under −20, when bare skin chills fast.
Count on some 26 humid days a year with the humidex past 30.
Ice storms, floods and heat waves are risks, not averages: they are on Neebing’s hazards page.
Flood & hazards →ECCC’s normals location: Thunder Bay
Behind the 1991–2020 normals for Thunder Bay are 4 stations, which ECCC combines into one record.
| Distance from the town | 23 km north-east |
| Station altitude | 199 m |
| Completeness | at least 20 years |
| WMO standard normals | No |
| Precipitation from | Atikokan, 167 km |
| Snowfall from | No location within 100 km |
| Coldest reading, 1991–2020 | −43.2°C |
| Hottest reading, 1991–2020 | 39.0°C |
| Average wind | 11.6 km/h on average, most often from the west |
| Next-nearest location | Atikokan, 167 km |
How Neebing compares
Placed among 2,611 Canadian towns and neighbourhoods of 2,500+, each on its nearest normals location; each dot is another location used in Ontario.
Neebing weather by month
Each month’s normals, 1991–2020: high, low, mean and precipitation.
| Month | High | Low | Mean | Rain & snow |
|---|---|---|---|---|
| January | −7.6°C | −19.2°C | −13.4°C | 33 mm |
| February | −5.2°C | −18.3°C | −11.8°C | 26 mm |
| March | 1.0°C | −11.8°C | −5.4°C | 34 mm |
| April | 8.9°C | −4.2°C | 2.4°C | 53 mm |
| May | 15.9°C | 1.9°C | 8.9°C | 80 mm |
| June | 21.6°C | 7.8°C | 14.8°C | 101 mm |
| July | 24.9°C | 11.0°C | 18.0°C | 117 mm |
| August | 24.2°C | 10.0°C | 17.1°C | 94 mm |
| September | 19.2°C | 5.5°C | 12.4°C | 102 mm |
| October | 10.9°C | −0.3°C | 5.3°C | 74 mm |
| November | 2.6°C | −6.7°C | −2.1°C | 40 mm |
| December | −4.5°C | −14.6°C | −9.6°C | 38 mm |
| Year | 9.3°C | −3.3°C | 3.0°C | 790 mm |
February strays furthest from its normal year to year, by 3.7°C; June the least
Records from 1991 to 2020: no month spans more than March, between −34.7°C (1996) and 23.9°C (2010).
Where Neebing’s numbers come from
Averages over 30 years, not a forecast.
- Normals: the closest ECCC location with twelve months of temperature normals, Thunder Bay, 1991–2020.
- Other locations: where a location publishes no full year of precipitation or snowfall, the nearest one that does supplies it, named beside those figures.
- Comparisons: the 2,500-plus towns and neighbourhoods of Canada, each read from its closest normals location; whole cities and reserves aren’t counted.
- Not on this page: a snowfall figure (none within 100 km), sunshine (none for 1991–2020) and the town’s own elevation.
Canadian Climate Normals 1991–2020 · ECCC Data Services End-use Licence. Data Source: Environment and Climate Change Canada
Questions about Neebing’s climate
How warm does Neebing get in summer?
Highs reach 24.9°C on an average July day; no month is warmer.
How cold does Neebing get in winter?
Of all twelve months, January has the coldest nights, about −19.2°C.
How much rain and snow does Neebing get?
The yearly total is about 790 mm. July gets 117 mm, the most of any month; February gets 26 mm, the least.
Are these figures for Neebing itself?
Not quite: they come from Thunder Bay, the closest ECCC normals location to Neebing.
Data Source: Environment and Climate Change Canada · ECCC Data Services End-use Licence Today’s forecast for Neebing →
Adapted from Statistics Canada (Census of Population 2021, population estimates 2025, 2021 census boundaries) under the Statistics Canada Open Licence; this does not constitute an endorsement by Statistics Canada. Neighbourhood names in some cities © OpenStreetMap contributors (ODbL).