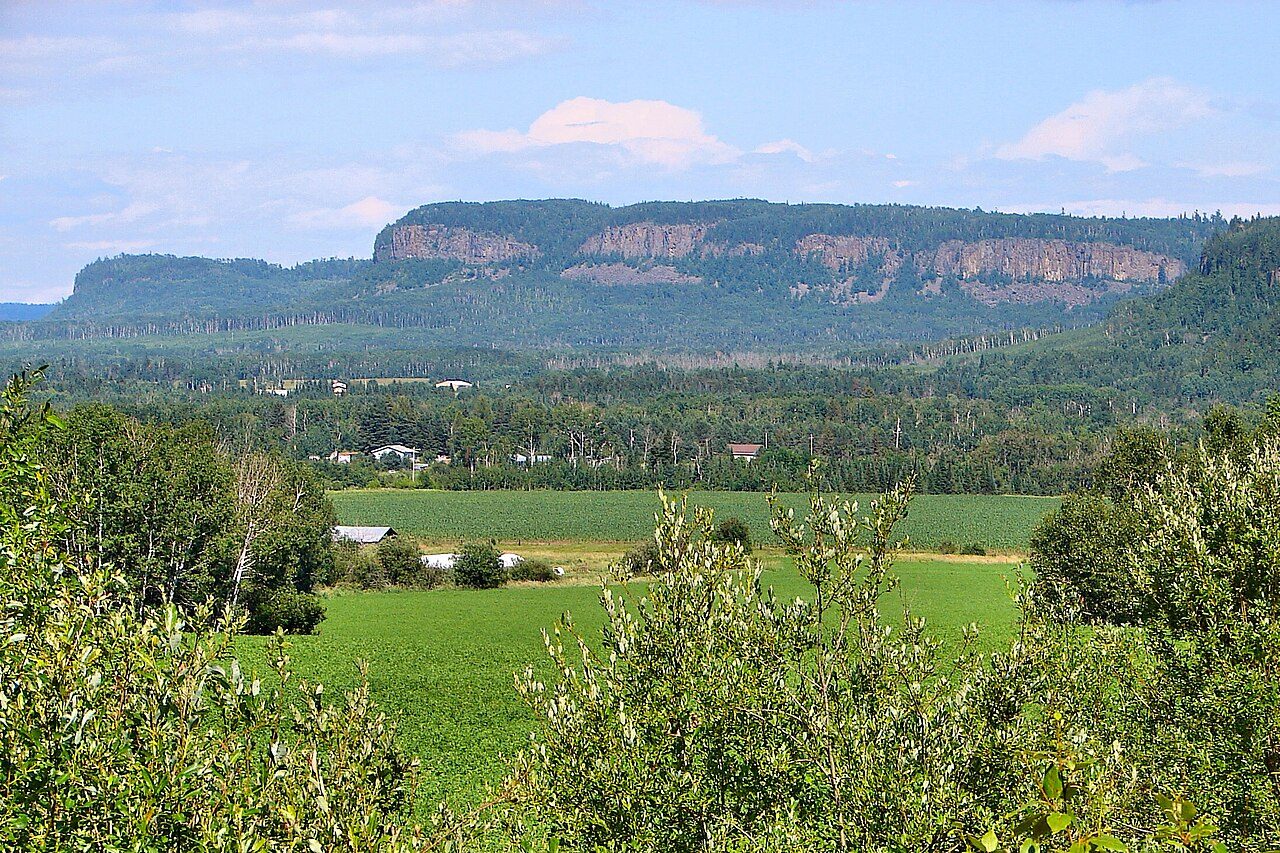
 Photo: P199 · CC BY-SA 3.0
Lake Superior National Marine Conservation Area lies 5.1 km beyond Neebing’s edge
OpenStreetMap shows one beach within 5 km, without a name. 23 protected areas lie within 10 km. Protected areas cover 4.1% of the land within 10 km; for the typical Canadian town it is 2.3%.
What Neebing has going for it outdoors
Each figure against Canadian towns of 2,500+; tap a tile for the detail.
For someone who likes to get outside, Neebing’s draw is Lake Superior National Marine Conservation Area within easy reach, with a provincial park at its edge close behind.
Neebing beside other Canadian towns, figure by figure
Each figure against the 2,611 Canadian towns and neighbourhoods of 2,500+ (not city hubs or reserves), with the town marked and the typical one’s line. Outdoors isn’t one of Canada’s graded subjects, so there’s no letter here: each figure is set against other Canadian towns instead.
CPCAD 2.9.0 (ECCC, 2026), OpenStreetMap (November 2026). Distances from the town’s outline.
Among 40 towns its size, Neebing ranks 12th for protected land within 10 km
The 40 Canadian towns nearest in population (2,390 to 2,587 residents), by the share of the land within 10 km that is protected. Hover for each one’s figures; click for its page.
For public protected areas, Neebing sits near the top of its size group: 12 of 39 have more.
Every town in the comparison
| Town | Protected within 10 km | In town | Areas | Routes | Beaches | |
|---|---|---|---|---|---|---|
| 1 | Anmore BC | 22% | 47% | 16 | 5 | 98 |
| 2 | Saint-Alexandre-de-Kamouraska QC | 19% | 0% | 28 | 0 | 0 |
| 3 | Gracefield QC | 19% | 19% | 34 | 0 | 6 |
| 4 | East Preston NS | 16% | 6.3% | 20 | 1 | 5 |
| 5 | Clearwater BC | 7.7% | 4.1% | 4 | 0 | 3 |
| 6 | Roberval QC | 6.1% | 1.2% | 22 | 0 | 0 |
| 7 | Saint-Louis-de-Gonzague QC | 5.8% | 0% | 20 | 0 | 0 |
| 8 | North Frontenac ON | 5.7% | 5.2% | 13 | 6 | 4 |
| 9 | Cap-Chat QC | 5.3% | 0.4% | 13 | 0 | 10 |
| 10 | Killaloe, Hagarty and Richards ON | 4.4% | 1.5% | 9 | 0 | 4 |
| 11 | Saint-Polycarpe QC | 4.2% | 0% | 11 | 0 | 2 |
| 12 | Neebing ON | 4.1% | 4% | 23 | 0 | 1 |
| 13 | Macassa ON | 4.1% | 0% | 18 | 1 | 0 |
| 14 | Saint-Damien QC | 4% | 3.2% | 22 | 1 | 9 |
| 15 | Unity SK | 3.4% | 0% | 3 | 0 | 0 |
| 16 | Sherwood ON | 3.4% | 0% | 19 | 2 | 0 |
| 17 | McNab SK | 2.6% | 0% | 4 | 0 | 1 |
| 18 | Mandeville QC | 2.5% | 1.8% | 19 | 4 | 7 |
| 19 | Esterhazy SK | 1.8% | 0% | 5 | 0 | 0 |
| 20 | City Commercial Core ON | 1.8% | 0% | 20 | 0 | 0 |
| 21 | Caswell Hill SK | 1.4% | 0% | 16 | 0 | 3 |
| 22 | Fossambault-sur-le-Lac QC | 1.3% | 7.8% | 15 | 0 | 14 |
| 23 | Pembina MB | 1.1% | 1.8% | 10 | 0 | 0 |
| 24 | Burrows-Keewatin MB | 1% | 0% | 10 | 0 | 0 |
| 25 | Elmwood AB | 0.8% | 0% | 3 | 2 | 0 |
| 26 | Hatley QC | 0.7% | 0% | 9 | 0 | 5 |
| 27 | Munroe West MB | 0.4% | 0% | 10 | 0 | 0 |
| 28 | Brooke-Alvinston ON | 0.3% | 0.2% | 6 | 0 | 0 |
| 29 | Rosedale AB | 0.3% | 0% | 2 | 1 | 1 |
| 30 | Minchau AB | 0.3% | 0% | 2 | 0 | 3 |
| 31 | Lunenburg NS | 0.1% | 0% | 19 | 0 | 5 |
| 32 | Salisbury NB | 0.1% | 2.1% | 4 | 0 | 0 |
| 33 | Dufferin MB | 0.1% | 0% | 1 | 0 | 0 |
| 34 | Ekota AB | 0.1% | 0% | 1 | 0 | 4 |
| 35 | Satoo AB | 0.1% | 0% | 1 | 0 | 2 |
| 36 | Saint-Éphrem-de-Beauce QC | 0% | 0% | 1 | 0 | 1 |
| 37 | Magrath AB | 0% | 0% | 0 | 0 | 0 |
| 38 | Nanton AB | 0% | 0% | 0 | 0 | 0 |
| 39 | Rimbey AB | 0% | 0% | 0 | 0 | 0 |
| 40 | Sexsmith AB | 0% | 0% | 0 | 0 | 0 |
Where the green is in Neebing
Green space, woods, protected areas and footpaths in and around the town; tap a number for its park or wood.
3 parks and woods to walk in, in or near Neebing
Largest first: Naomi Island leads with 5.4 ha. Numbers match the map.
Source: OpenStreetMap parks, gardens, commons and woods with a name, in the town or within 400 m, © OpenStreetMap contributors, ODbL. Sizes are the mapped outline’s.
Few people in Neebing live near a park
Residents of each 2021 dissemination area, at a point inside it, within 400 m (about a 5-minute walk) of a park or playing field mapped on OpenStreetMap.
That is below the typical Canadian town (83%). That leaves about 2,400 people more than a short walk away.
4.1% of the country within 10 km of Neebing is protected
Every protected and conserved area in CPCAD within 10 km of the town’s edge: parks, reserves, wildlife areas and conservation land.
9 of the 23 belong to a government or an Indigenous nation. Biggest of the named areas: Lake Superior National Marine Conservation Area, 1,088,000 ha. The figures include 14 private conservation areas, left unnamed.
Source: Canadian Protected and Conserved Areas Database (CPCAD) 2.9.0, Environment and Climate Change Canada. Contains information licensed under the Open Government Licence – Canada.
Big parks near Neebing
National parks (Parks Canada) and provincial or territorial parks by direction and distance from the town’s edge: every one within 10 km, and the nearest of each within 100 km.
Laverendrye Provincial Park
Pigeon River Provincial Park
Thompson Island Provincial Park
Devon Road Mesa Provincial Park
Fraleigh Lake Provincial Park
Lake Superior National Marine Conservation Area
7 provincial parks lie within 10 km.
Source: CPCAD 2.9.0 (ECCC): areas and outlines, distances outline to outline; directions from the town’s centre point.
Neebing and its edge hold 60 km of footpath
OpenStreetMap footpaths, paths, bridleways and steps, and tracks open on foot, in the town and 1 km around it; woods as mapped (landuse=forest, natural=wood).
Footpaths · km per km²
Share of the land · mapped woods and forest
It has fewer paths per km² than 92% of Canadian towns. For woods, it beats 90% of Canadian towns.
Source: OpenStreetMap, © OpenStreetMap contributors, ODbL. Mapping varies by place: a dense figure can mean keen local mappers as much as many paths.
OpenStreetMap shows no walking route near Neebing
Named walking and hiking routes on OpenStreetMap with at least 300 m within 2 km of the town, longest first; national routes lead.
No walking route is mapped within 2 km of the town. Mapping of trails as routes varies a great deal across Canada.
Source: OpenStreetMap (route relations hiking, foot and walking), © OpenStreetMap contributors, ODbL. Trans Canada Trail sections as OSM maps them.
The walking year in Neebing
Environment and Climate Change Canada’s 1991–2020 normals from Atikokan (167 km), and daylight at the town’s latitude. Good months: 12½+ hours of daylight, highs of 15–30 °C, little rain.
| Jan | Feb | Mar | Apr | May | Jun | Jul | Aug | Sep | Oct | Nov | Dec | |
|---|---|---|---|---|---|---|---|---|---|---|---|---|
| Daylight (h) | 8.8 | 10.1 | 11.7 | 13.6 | 15.2 | 16.0 | 15.7 | 14.3 | 12.5 | 10.7 | 9.1 | 8.4 |
| High (°C) | -8 | -5 | 1 | 9 | 16 | 22 | 25 | 24 | 19 | 11 | 3 | -5 |
| Rain & snow (mm) | 33 | 26 | 34 | 53 | 80 | 101 | 117 | 94 | 102 | 74 | 40 | 38 |
Highs peak near 25 °C in July and fall to -8 °C in January. Summer storms make July the wettest month, 117 mm; February sees 26 mm. The climate in Neebing →
A beach within 5 km of Neebing
Beaches on OpenStreetMap within 5 km of the town’s edge, nearest first, with directions.
Water quality isn’t shown: there’s no open national record of beach tests. Local health authorities post advisories.
Source: OpenStreetMap (natural=beach), © OpenStreetMap contributors, ODbL.
Near Neebing: 16 viewpoints, 5 waterfalls
Viewpoints, peaks, waterfalls, picnic sites, nature reserves, playgrounds, dog parks, campsites and boat launches mapped within 2 km of the town.
Highest of the named peaks: Mount Mollie, 403 m. Top of the list: nature reserves, 27 of them.
Every named place, with directions
Viewpoints 16
Plus 13 viewpoints without a name on the map.
Hills and peaks 2
Waterfalls 5
Plus 2 waterfalls without a name on the map.
Nature reserves 27
Plus 19 nature reserves without a name on the map.
Picnic sites 3
Plus 3 picnic sites without a name on the map.
Playgrounds 1
Plus 1 playground without a name on the map.
Slipways 4
Source: OpenStreetMap (tourism, natural, waterway and leisure tags), © OpenStreetMap contributors, ODbL.
Next to Neebing
The nearest places, coloured by the share of the land within 10 km that is protected; tap one for its outdoors page. No closer places have figures: these lie 23–48 km from Neebing.
| Town | Protected within 10 km | Areas | Routes | Beaches |
|---|---|---|---|---|
| Neebing | 4.1% | 23 | 0 | 1 |
| Fort William 52 23 km | 0.3% | 2 | 0 | 3 |
| Oliver Paipoonge 25 km | 0.7% | 5 | 0 | 1 |
| Thunder Bay 30 km | 0.1% | 3 | 0 | 4 |
| Thunder Bay, Unorganized 48 km | 18% | 136 | 6 | 347 |
More routes are mapped around Thunder Bay, Unorganized (6). For protected land, Thunder Bay, Unorganized has twice as much or more.
What this data can and can’t tell you
- Private land. Land owned by individuals, companies or conservation groups counts toward the figures but is never named: a person’s land isn’t a place to visit.
- National and provincial parks. The nearest national park and the nearest provincial park are always shown when they are within 100 km.
- Protected land. The share is of the land and water within 10 km of the town’s outline, from CPCAD’s mapped areas; marine areas count, so a coastal town can score high on water.
- Beaches. Beaches are OpenStreetMap’s, named or not; in the north many are unnamed shoreline imports.
- Walking routes. Only named route relations count; a park’s own path network may not show unless it is mapped as a route.
Questions about the outdoors in Neebing
Where can you swim near Neebing?
One beach is mapped within 5 km, though without a name.
How far is the nearest provincial park from Neebing?
Devon Road Mesa Provincial Park begins at the town’s edge.
How much land around Neebing is protected?
Yes: 4.1% of the land within 10 km is protected.
What is the nearest national park to Neebing?
It is Lake Superior National Marine Conservation Area, 5.1 km off.
What is the largest protected area near Neebing?
It is Lake Superior National Marine Conservation Area, a national marine conservation area covering 1,088,000 ha.
Sources for this page on Neebing
Protected areas: Canadian Protected and Conserved Areas Database (CPCAD) 2.9.0, Environment and Climate Change Canada, 2026: every area within 10 km and the nearest national and provincial parks, measured outline to outline.
Walking routes and beaches: OpenStreetMap, November 2026: named hiking, foot and walking route relations within 2 km and beaches within 5 km.
Towns: Statistics Canada 2021 Census boundaries and populations; the comparison is the Canadian towns and neighbourhoods of 2,500+, not city hubs or reserves.
When to go: Environment and Climate Change Canada, Canadian Climate Normals 1991–2020, from the nearest station that publishes them.
Green space, paths, woods, things to do: OpenStreetMap (Geofabrik’s Canada extract), November 2026: parks, gardens, playing fields, woods, footpaths, the coastline and things to do in and around each town.
Residents: Statistics Canada 2021 Census dissemination areas (population, boundaries), each at a point inside it.
Walking routes and beaches © OpenStreetMap contributors, available under the Open Database Licence (ODbL).
Not on this page: trailheads and trail grades, and beach water quality. No open Canadian dataset gives these for every town yet.
Adapted from Statistics Canada (Census of Population 2021, population estimates 2025, 2021 census boundaries) under the Statistics Canada Open Licence; this does not constitute an endorsement by Statistics Canada. Neighbourhood names in some cities © OpenStreetMap contributors (ODbL).