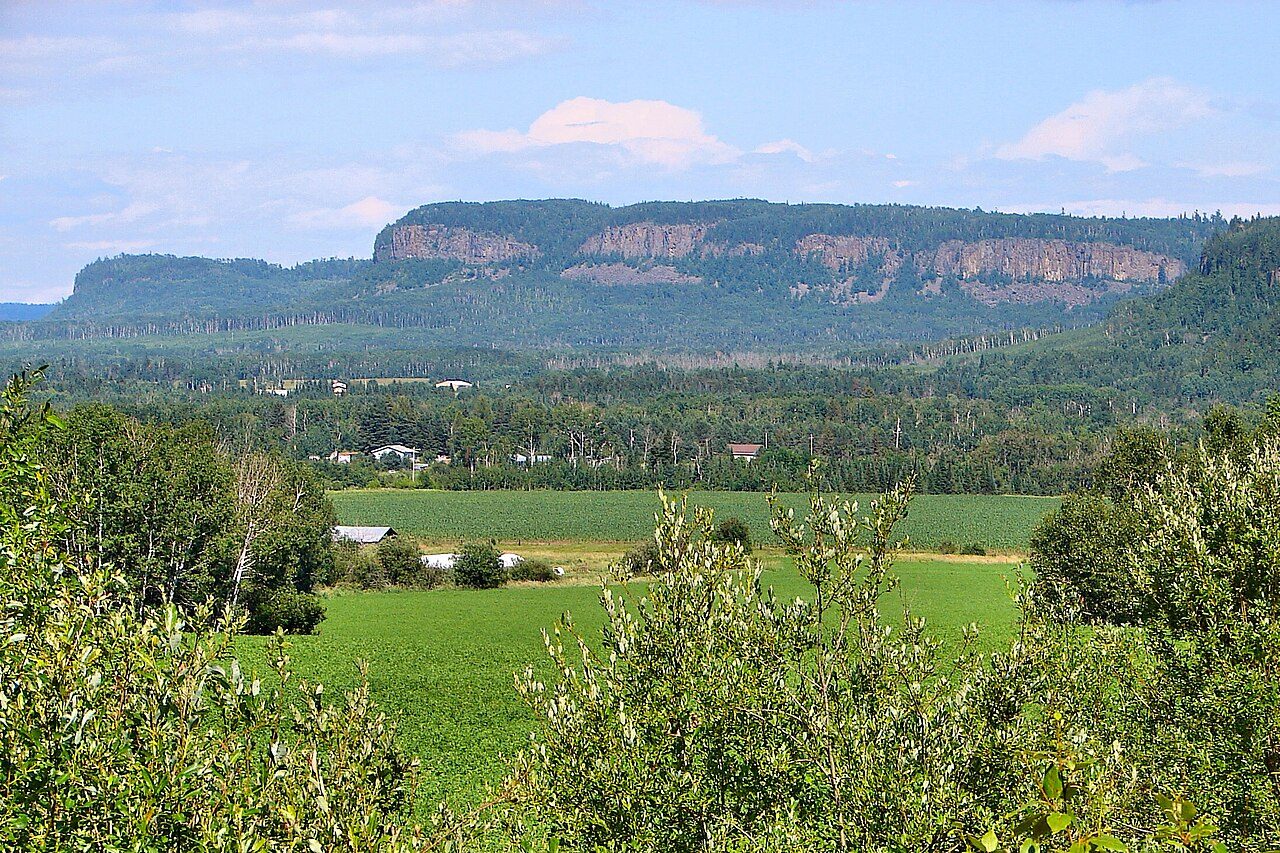
 Photo: P199 · CC BY-SA 3.0
Fewer households are stretched by shelter costs in Neebing: 6% spend 30%+ of income, against 18% in the typical Canadian town
The census put the median home at $348,000 in 2021, or 3.7 times a median household income of $93,300. What owners reported in May 2021 is an opinion of value; interest rates and prices have both moved since. For renters, a two-bedroom averaged $1,493 a month in October 2025; twelve months of that is 19% of the median household income. Neebing shares its two-bedroom rent numbers with the rest of the Thunder Bay metro area. With its rents weighed too, Neebing grades C for cost of living.
What Neebing’s housing numbers say
Owning takes fewer years of income in Neebing
The years of pay a home costs here fall 20% short of the typical Canadian town’s. Affordability ↓
Each figure against the typical Canadian town of 2,500 or more: census 2021 values, CMHC or census rents, StatCan’s housing and transport index.
Neebing grades C for cost of living
The two measures the grade weighs, each against every one of the Canadian towns of 2,500 or more.
Rent is the heavier of the two costs: home values against pay compare better with the typical Canadian town.
Against what households earn, Neebing homes cost 3.4 years less than in Ontario’s towns
How many years of household income (2020, before tax) the median home was worth at the 2021 census, and how much of it a year of rent takes, against the towns of 2,500 or more.
Years of household income for the median home
A year’s rent, share of household income
A year of the two-bedroom rent takes 2 points less of local pay than it does in Ontario’s towns.
Statistics Canada, Census 2021 (home values, household income, census rents); CMHC Rental Market Survey, October (two-bedroom rents where CMHC counts).
A two-bedroom rents for about $1,493 a month
The figures are CMHC’s for Thunder Bay in October 2025, with the two-bedroom average less than the $1,598 of the typical Canadian town.
By size a month, the tick is the typical Canadian town
CMHC Rental Market Survey, October, via Statistics Canada table 34-10-0133: row and apartment buildings of three or more units.
Who is stretched: owners and renters
The census 2021 share of households whose rent or mortgage, utilities, taxes and fees come to 30% or more of income.
Spending 30%+ of income on shelter the tick is the typical Canadian town
Statistics Canada, Census 2021: households spending 30% or more of total income on shelter costs.
A $2,875 yearly tax figure puts Neebing below Ontario’s towns, whose median is $3,418
Per household, 2024: the residential taxes a municipality reported to Ontario, school tax included, over its households. Another province’s figure is built differently.
The places next door, same measure tick: median of Ontario’s towns
Among the neighbours of Neebing, Oliver Paipoonge is highest at $3,703 and Shuniah lowest at $2,415.
Ontario Ministry of Municipal Affairs and Housing, Financial Information Return 2024, schedule 22 (Open Government Licence – Ontario).
94% of households own their home; 5% rent
Who owned and who rented at the 2021 census, against the medians of other towns. Ownership runs above Ontario’s towns, where the median is 76%.
Next to Neebing, values range from $40K more in Oliver Paipoonge to $68K less in Thunder Bay, Unorganized
The places around Neebing: home value at the 2021 census, rent, and value over income. No closer places have figures: these lie 23–48 km from Neebing.
| Town | Grade | Median home value | Rent | ÷ income |
|---|---|---|---|---|
| Neebing | C | $348K | $1,493 | 3.7× |
| Fort William 52 (23 km) | – | – | $1,493 | – |
| Oliver Paipoonge (25 km) | B− | $388K | $1,493 | 3.6× |
| Thunder Bay (30 km) | C− | $300K | $1,493 | 3.9× |
| Thunder Bay, Unorganized (48 km) | A− | $280K | $548 | 3.4× |
Values: census 2021. Rent: CMHC or census.
What this data can and can’t tell you
- Rents. CMHC’s count covers row houses and apartment buildings built to rent, every October; privately rented condos are a separate survey not used here.
- Income is the town’s own. Household income is the 2020 census median, before tax and with that year’s COVID-19 benefits in it; neighbourhoods get theirs from their areas’ income groups.
- Compared with what. Comparisons use the middle town of 2,500+ across Canada and the middle one among Ontario’s towns; reserves and whole cities aren’t in either.
Questions about living costs in Neebing
Is Neebing expensive to live in?
Cheaper than the middle of Ontario’s towns (7.1 years of income), once pay is counted.
What do households in Neebing earn?
Half of households earned more than $93,300 in 2020, before tax: more than the medians of Ontario’s towns ($91,600) and Canada’s towns ($85,900).
What does owning a home cost each month in Neebing?
At the 2021 census, half of owners paid more than $930 a month for shelter, counting the mortgage, taxes, fees and utilities.
How much is rent in Neebing?
A one-bedroom averaged $1,173 a month in October 2025, a two-bedroom $1,493 and a three-bedroom $1,794.
Sources: Statistics Canada, Census of Population 2021 · CMHC Rental Market Survey (Statistics Canada table 34-10-0133). Under the Statistics Canada Open Licence.
Adapted from Statistics Canada (Census of Population 2021, population estimates 2025, 2021 census boundaries) under the Statistics Canada Open Licence; this does not constitute an endorsement by Statistics Canada. Neighbourhood names in some cities © OpenStreetMap contributors (ODbL).