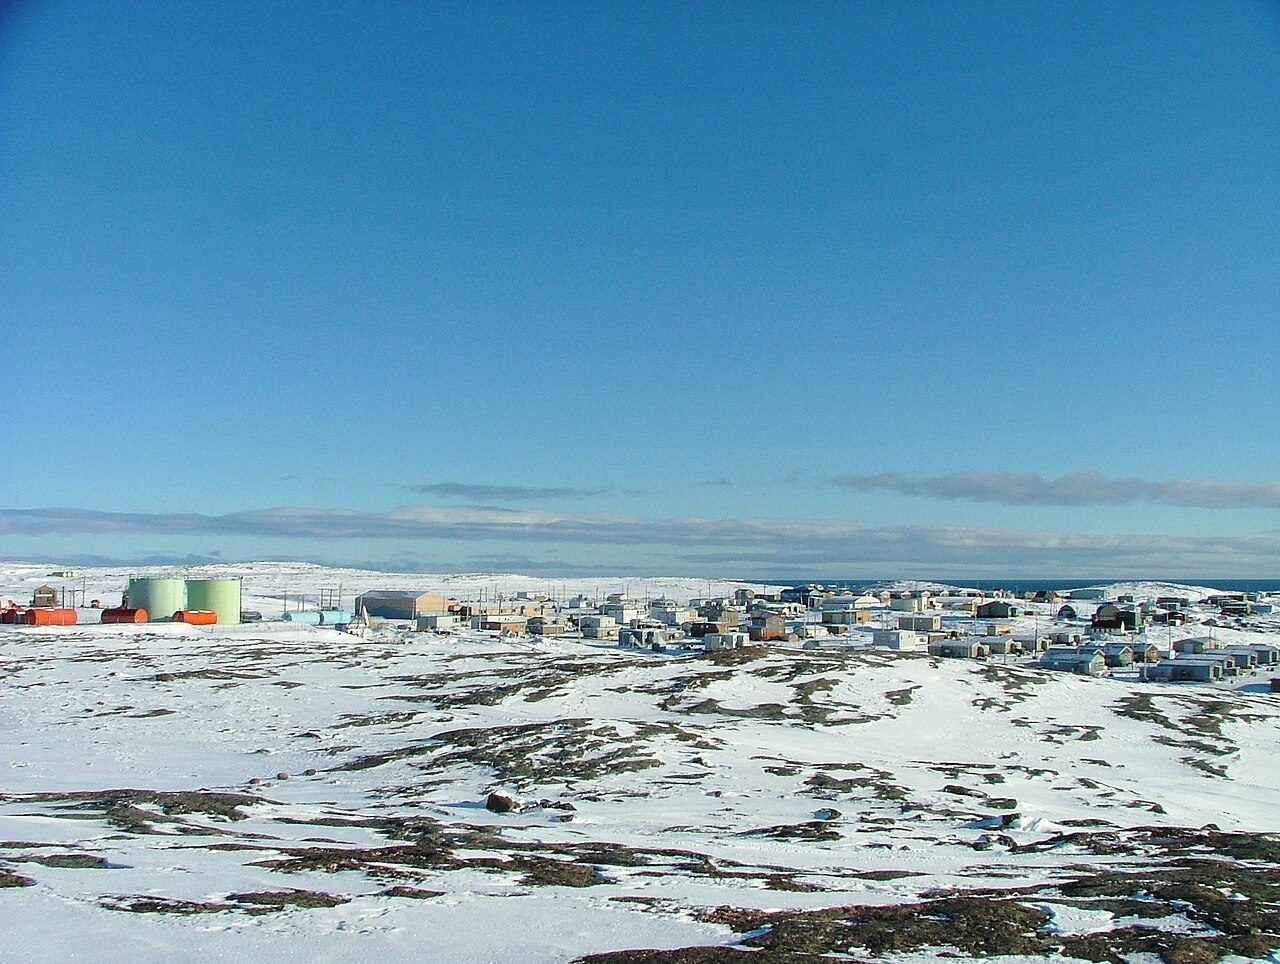
 Photo: https://www.flickr.com/people/naturallight/ Leslie Philipp · CC BY 2.0
Naujaat records more crime per resident than four in five Canadian towns
Split in two, the index gives 205.1 for violence and 73.4 for everything else (normally 86.4 and 62.8). The grade is C−, built on crime the police covering Naujaat reported from 2023 to 2025. Per 1,000 residents a year, 39.5 violent incidents and 57.5 incidents of property crime were recorded, against 12.0 and 31.2 in the typical Canadian town of 2,500+.
Statistics Canada, police-reported crime, 2023–2025 means. The index weighs each crime by its seriousness; rates are incidents per 1,000 residents a year. Data for crime severity, crime rate and incident counts covers the Naujaat detachment area.
What stands out about safety in Naujaat
Mischief: high for a town its size
Naujaat records 52.1 incidents of mischief per 1,000 residents a year, against 4.2 in the typical town among Canadian towns of 2,500 people or more. By type ↓
Above-typical clearance
Police cleared 64% of Naujaat’s crime, weighted by seriousness (76% of violent crime, 50% of the rest), against 34% across Canadian towns of 2,500 people or more. Questions ↓
The violent half stands out
Set beside the typical Canadian town of 2,500+, Naujaat’s two halves part ways: 205.1 for violence (typical 86.4) and 73.4 for the rest (typical 62.8). By type ↓
Written from Statistics Canada’s police-reported crime by police service and detachment, 2023–2025. Figures are what police recorded, not convictions.
What’s behind Naujaat’s grade
The grade weighs the Crime Severity Index and its violent half, averaged over 2023–2025, against every Canadian town and city neighbourhood of 1,000 people or more.
The Crime Severity Index and its two halves, beside the typical figure for Canadian towns of 2,500 people or more.
Naujaat’s crime by kind
Against the typical town its size, Naujaat runs highest on mischief (52.1 per 1,000 against 4.2) and assault (24 per 1,000 against 6.7).
Every Statistics Canada violation line
| Violation | Incidents a year | Per 1,000 | Cleared |
|---|---|---|---|
| Homicide | 0 | 0 | — |
| Sexual violations against children | 3 | 2.2 | — |
| Assaults against a peace officer | 2 | 1.5 | — |
| Firearms: use, discharge, pointing | 0 | 0 | — |
| Robbery | 0 | 0 | — |
| Forcible confinement or kidnapping | 0 | 0 | — |
| Other violent violations | 0.3 | 0.2 | — |
| Breaking and entering | 3.3 | 2.4 | — |
| Possession of stolen property | 0 | 0 | — |
| Theft of a motor vehicle | 0.7 | 0.5 | — |
| Theft over $5,000 | 0 | 0 | — |
| Theft under $5,000 | 1.7 | 1.2 | — |
| Mischief | 71.7 | 52.1 | 54% |
| Weapons violations | 0.3 | 0.2 | — |
| Administration of justice violations | 3.7 | 2.7 | — |
| Other Criminal Code violations | 1 | 0.7 | — |
| Drug violations | 0.3 | 0.2 | — |
| Impaired driving | 2.3 | 1.7 | — |
| Failing to stop or remain | 0 | 0 | — |
Statistics Canada’s violation groups for the whole police service or detachment, incidents a year its own. Cleared: incidents solved by a charge or otherwise, as a share of those reported.
Incidents per 1,000 residents a year, 2023–2025 means, against the typical figure for Canadian towns of 2,500 people or more.
1,390 residents, about 54 violent incidents a year: the police area Naujaat belongs to, 2023–2025
Violent incidents per 1,000 a year, 2023–2025
Property crimes per 1,000 a year, 2023–2025
Statistics Canada counts actual incidents; those police record as unfounded are listed apart and kept out of its crime rates and severity index. Each incident is filed under its most serious violation, which the survey sets partly by the maximum penalty.
And about 79 property crimes, plus 44 other violations, a year (2023–2025 average). Each dot is one resident; each coloured dot, one incident a year at the area’s rates.
Three years of Naujaat’s crime index
Crime Severity Index
The middle year, 2024, was the heaviest at 130.2; 2023 was lightest, at 88.2. For the typical Canadian town of 2,500+, 2023 gave 70.6 and 2025 gave 62.9.
Every year as a table
| Year | Naujaat | Typical town of 2,500+ |
|---|---|---|
| 2025 | 112.6 | 62.9 |
| 2024 | 130.2 | 68.5 |
| 2023 | 88.2 | 70.6 |
Statistics Canada, Crime Severity Index by police service, each year as published. Typical: the median of Canadian towns of 2,500 people or more.
The Crime Severity Index of the police covering Naujaat, each year, against the typical Canadian town of 2,500+.
What this data can and can’t tell you
- Read with care. About 1,385 people live in the area these figures cover; at that size one bad year shows up large. Statistics Canada says: “Data for police services or detachments with populations less than 5,000 should be used with caution.”
- Town and surroundings together. An RCMP or OPP detachment reports one set of figures for everywhere it polices, so Naujaat’s are shared with its surroundings.
- Reading the number. The index is scaled so that Canada as a whole scored 100 in its base year, 2006: a town at 50 has half that severity per resident.
- Solved cases. A crime is cleared when police lay or recommend a charge, or solve it another way; the weighted rate counts serious crimes for more.
- How serious, not how safe. Statistics Canada builds the index from every crime police record, weighted by how seriously the courts treat it, and divides by the population. It adds a warning of its own: “The CSI is not an indicator of overall safety and should be interpreted in the broader community context.”
Questions about safety in Naujaat
Is Naujaat safe?
With 39.5 violent incidents and 57.5 property crimes per 1,000 residents a year, Naujaat comes to 110.3 on the Crime Severity Index (2023–2025); Canadian towns of 2,500 people or more have a median of 67.2.
What is the most common crime in Naujaat?
Most often it is mischief: 52.1 per 1,000 residents a year. Next come other Criminal Code offences at 30.4 and assault at 24.
Is crime going up in Naujaat?
Over 2023–2025 the index climbed 28%, to 112.6 from 88.2. With few people or missing years behind it, the change is a rough one.
How much of Naujaat’s crime do police solve?
The weighted clearance rate is 64%: 76% for violent crime and 50% for non-violent. For the typical Canadian town of 2,500+ it is 34%.
Whose figures are these?
Those of the police serving Naujaat together with its neighbours or the countryside around it.
Source: Statistics Canada, police-reported crime by police service and detachment, 2023–2025 (Statistics Canada Open Licence); TownRatings calculation.
Sources: Statistics Canada, Crime severity index and weighted clearance rates, police services (tables 35-10-0186 to 0190, 0061, 0063, 0064), 2023–2025 · Statistics Canada, Incident-based crime statistics by detailed violations, police services (35-10-0178 to 0185) · Safety Grade: TownRatings calculation. Under the Statistics Canada Open Licence.
Adapted from Statistics Canada (Census of Population 2021, population estimates 2025, 2021 census boundaries) under the Statistics Canada Open Licence; this does not constitute an endorsement by Statistics Canada. Neighbourhood names in some cities © OpenStreetMap contributors (ODbL).