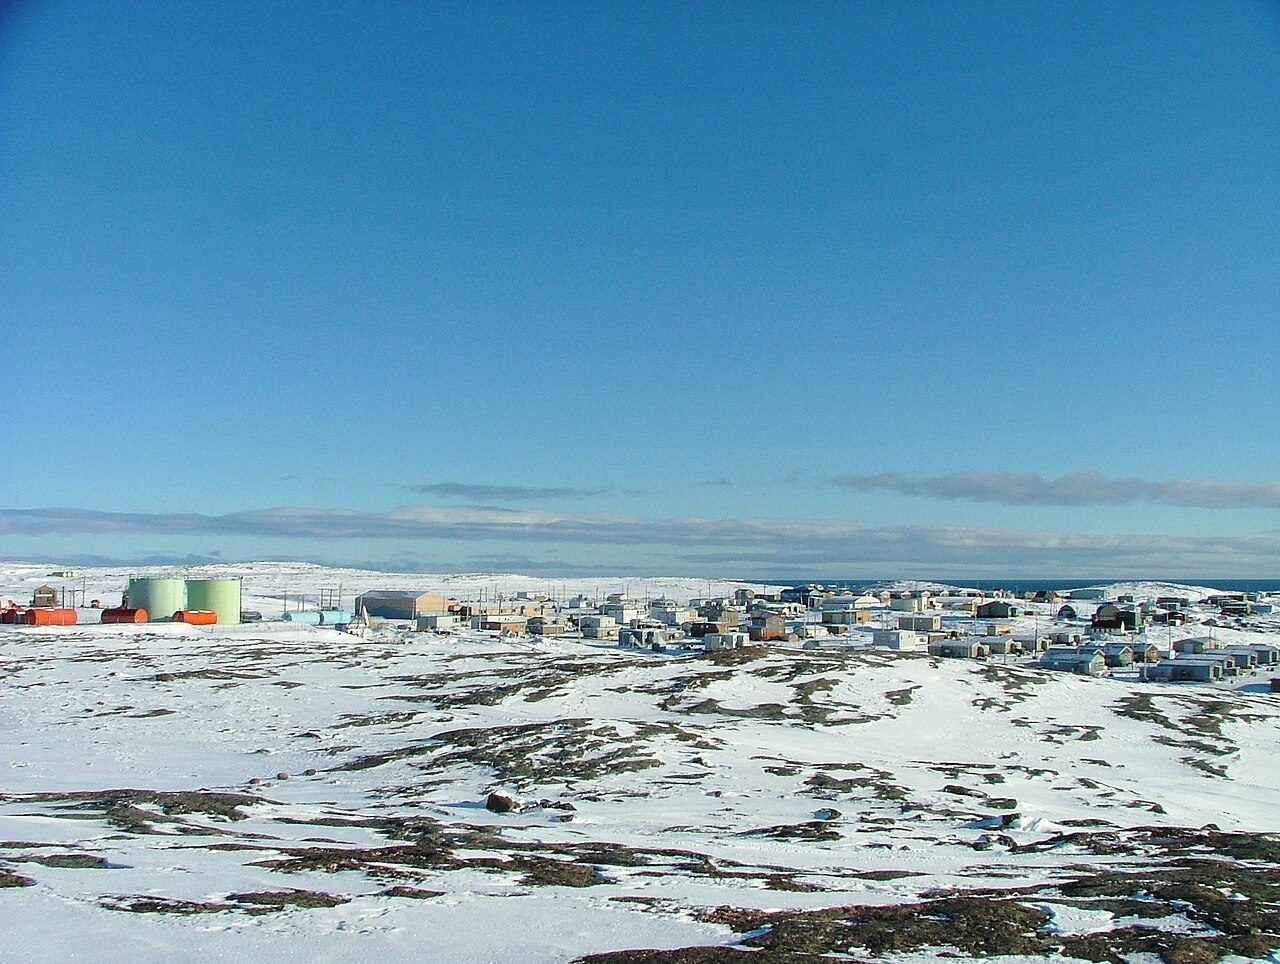
 Photo: https://www.flickr.com/people/naturallight/ Leslie Philipp · CC BY 2.0
Naujaat grew mostly after 1961: 100% of its homes
Most towns have 18%, so Naujaat has 0 times as much. The 2021 Census dates 6.8% of its homes to 2016 or later, against 4.1% in most towns.
Most of Naujaat’s homes went up from 2001 to 2015: 39%
Over half of the homes in Naujaat were already standing by 2001. In Naujaat, 27% of homes date from 1961 to 1980, much as in most towns (27%). 27% of Naujaat’s homes were built from 1981 to 2000, close to the typical town’s 23%.
2021 Census, private dwellings by period of construction (Statistics Canada); the typical town is the middle Canadian town of 2,500 or more.
Naujaat in brief
Few of its homes are old, 0% before 1961, against 18% in the typical town.
Contains information licensed under the Open Government Licence – Canada (Parks Canada).
Sources: Parks Canada, Directory of Federal Heritage Designations · Canadian Register of Historic Places (federal extract) · Wikidata (CC0) for map points, other names and articles · Statistics Canada, 2021 Census (homes by period of construction). Under the Statistics Canada Open Licence.
Adapted from Statistics Canada (Census of Population 2021, population estimates 2025, 2021 census boundaries) under the Statistics Canada Open Licence; this does not constitute an endorsement by Statistics Canada. Neighbourhood names in some cities © OpenStreetMap contributors (ODbL).