First pick
sncəcmałqtn (BX Ranchlands)
Park or garden
65 ha3.1 km of path
40 minto walk all 3.1 km of path
1.8 km south-westfrom the centre
BX Ranch Trail
Directionsto a point inside
Each edition grades its towns against each other only.
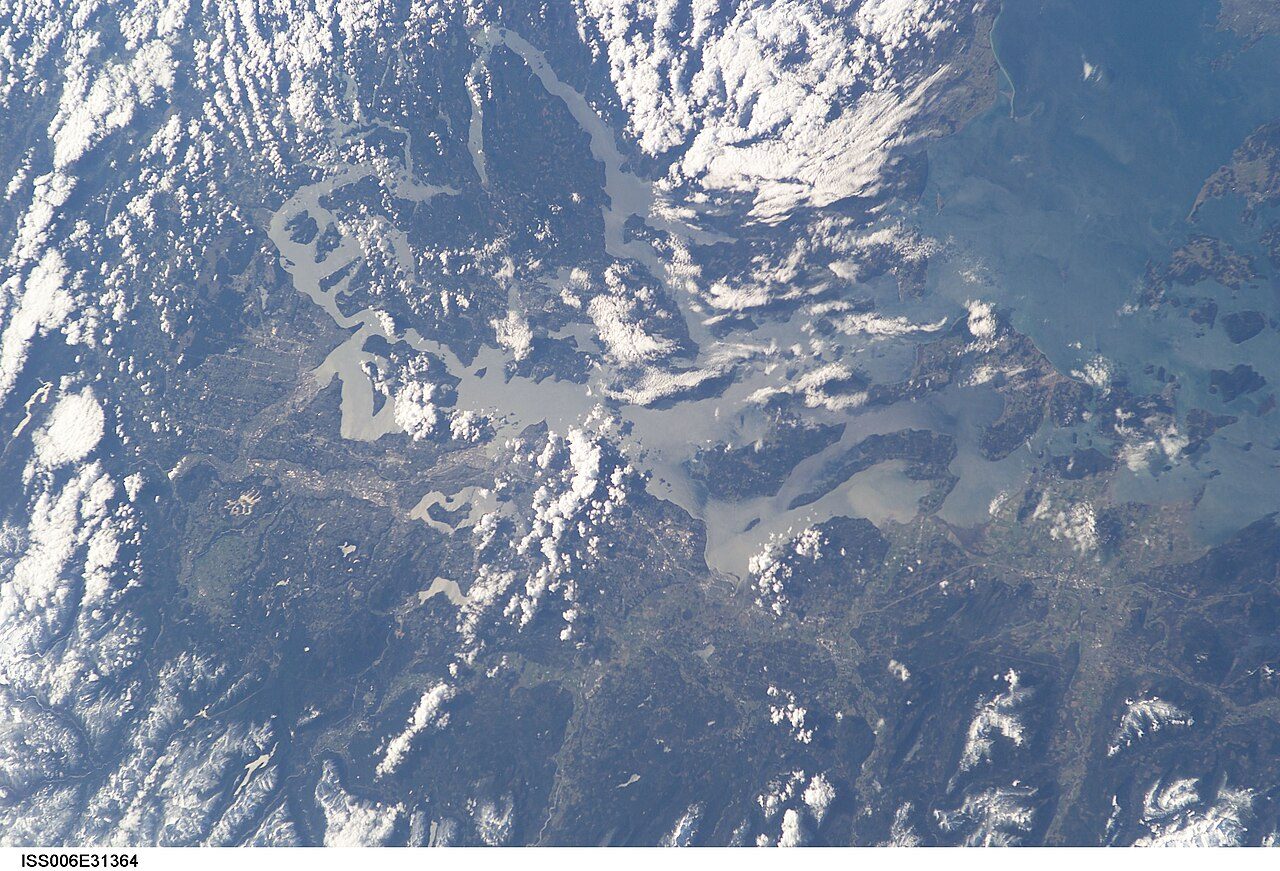 Photo: Earth Science and Remote Sensing Unit , Lyndon B. Johnson Space Center · Public domain
6.1% of the land and water within 10 km is protected (the typical Canadian town: 2.3%). Within its own boundary, 19% of the town is protected. 3 beaches are mapped within 5 km, the nearest Kal Beach.
Each figure against Canadian towns of 2,500+; tap a tile for the detail.
What Electoral Area C, North Okanagan has most to offer outdoors is a provincial park at its edge, with protected land around it close behind.
Each figure against the 2,611 Canadian towns and neighbourhoods of 2,500+ (not city hubs or reserves), with the town marked and the typical one’s line. Outdoors isn’t graded in Canada. The page compares each figure with other towns and leaves it there.
CPCAD 2.9.0 (ECCC, 2026), OpenStreetMap (November 2026). Distances from the town’s outline.
The 40 Canadian towns nearest in population (4,957 to 5,104 residents), by the share of the land within 10 km that is protected. Hover for each one’s figures; click for its page.
Electoral Area C, North Okanagan beats most towns its size for protected land nearby; 8 of 39 do better.
| Town | Protected within 10 km | In town | Areas | Routes | Beaches | |
|---|---|---|---|---|---|---|
| 1 | Saint-Donat QC | 41% | 6.7% | 21 | 1 | 6 |
| 2 | Electoral Area F, Cariboo BC | 29% | 27% | 16 | 0 | 2 |
| 3 | Electoral Area D, Peace River BC | 19% | 18% | 56 | 3 | 123 |
| 4 | Northern Bruce Peninsula ON | 11% | 30% | 97 | 2 | 13 |
| 5 | Bells Corners East ON | 9.2% | 4.6% | 21 | 3 | 5 |
| 6 | Lemoyne QC | 7.6% | 0% | 26 | 0 | 5 |
| 7 | Falkirk East ON | 7% | 0% | 16 | 0 | 0 |
| 8 | Cobble Hill BC | 6.6% | 4.5% | 51 | 0 | 6 |
| 9 | Electoral Area C, North Okanagan BC | 6.1% | 19% | 7 | 0 | 3 |
| 10 | Webber Greens AB | 6.1% | 0% | 9 | 0 | 0 |
| 11 | Electoral Area F, North Okanagan BC | 5.9% | 4.7% | 26 | 0 | 7 |
| 12 | Nipawin SK | 4.1% | 0% | 4 | 0 | 0 |
| 13 | Palliser AB | 4% | 0% | 3 | 0 | 5 |
| 14 | Annapolis County, Subdivision B NS | 3.9% | 0.9% | 44 | 0 | 4 |
| 15 | Tyendinaga ON | 3% | 2.8% | 30 | 0 | 0 |
| 16 | Huntington ON | 2.9% | 0% | 19 | 3 | 0 |
| 17 | Idlewood ON | 2.8% | 12% | 22 | 1 | 0 |
| 18 | Gibsons BC | 2.7% | 4.8% | 43 | 0 | 57 |
| 19 | Cumberland BC | 2.6% | 8.1% | 44 | 1 | 1 |
| 20 | Hastings Highlands ON | 2.4% | 0.5% | 8 | 0 | 3 |
| 21 | Morin-Heights QC | 2.2% | 0.9% | 23 | 0 | 3 |
| 22 | Hearst ON | 2% | 0% | 1 | 0 | 1 |
| 23 | Meinzinger Park-Lakeside ON | 1.7% | 4.4% | 22 | 0 | 0 |
| 24 | Bridgwater Forest MB | 1.7% | 4.1% | 20 | 0 | 1 |
| 25 | River-Osborne MB | 1.5% | 0% | 22 | 4 | 0 |
| 26 | Central Business District SK | 1.5% | 5.4% | 17 | 0 | 3 |
| 27 | Lord Roberts MB | 1.4% | 0% | 25 | 1 | 0 |
| 28 | Edgemont AB | 1.4% | 0% | 12 | 1 | 0 |
| 29 | Westmount ON | 1.3% | 0% | 18 | 0 | 1 |
| 30 | Westmount AB | 0.9% | 0% | 2 | 2 | 1 |
| 31 | Robertson MB | 0.7% | 0% | 13 | 0 | 0 |
| 32 | North Park SK | 0.7% | 0% | 14 | 1 | 3 |
| 33 | Sussex NB | 0.5% | 0% | 4 | 0 | 3 |
| 34 | Kildonan Drive MB | 0.3% | 1.3% | 10 | 0 | 0 |
| 35 | Twin Brooks AB | 0.3% | 0.4% | 4 | 0 | 1 |
| 36 | Anthony Henday South East AB | 0.2% | 0% | 3 | 0 | 4 |
| 37 | Saint-Germain-de-Grantham QC | 0.1% | 0% | 1 | 0 | 0 |
| 38 | Carbonear NL | 0% | 0% | 0 | 0 | 5 |
| 39 | Altona MB | 0% | 0% | 0 | 0 | 0 |
| 40 | Capilano AB | 0% | 0% | 0 | 1 | 1 |
Green space, woods, protected areas and footpaths in and around the town; tap a number for its park or wood.
The biggest is sncəcmałqtn (BX Ranchlands), 65 ha. Biggest first, numbered as on the map.
Add sncəcmałqtn (BX Ranchlands) to Becker Lake Recreation Site and you have 82% of it.
Source: OpenStreetMap parks, gardens, commons and woods with a name, in the town or within 400 m, © OpenStreetMap contributors, ODbL. Sizes are the mapped outline’s.
Residents of each 2021 dissemination area, at a point inside it, within 400 m (about a 5-minute walk) of a park or playing field mapped on OpenStreetMap.
The typical Canadian town does better, at 83%. For about 3,500 people, the nearest park is over 400 m away.
Every protected and conserved area in CPCAD within 10 km of the town’s edge: parks, reserves, wildlife areas and conservation land.
Public bodies own 6 of the 7; land trusts and private owners hold the others. Silver Star Park covers 5,573 ha, the most of any named area. One more area within 10 km is private land, held by a landowner or a conservation group: counted here, not named.
Source: Canadian Protected and Conserved Areas Database (CPCAD) 2.9.0, Environment and Climate Change Canada. Contains information licensed under the Open Government Licence – Canada.
National parks (Parks Canada) and provincial or territorial parks by direction and distance from the town’s edge: every one within 10 km, and the nearest of each within 100 km.
There are 3 provincial parks within 10 km.
Source: CPCAD 2.9.0 (ECCC): areas and outlines, distances outline to outline; directions from the town’s centre point.
OpenStreetMap footpaths, paths, bridleways and steps, and tracks open on foot, in the town and 1 km around it; woods as mapped (landuse=forest, natural=wood).
For woods, it beats 97% of Canadian towns. Paths are thinner on the ground than in 63% of Canadian towns.
Source: OpenStreetMap, © OpenStreetMap contributors, ODbL. Mapping varies by place: a dense figure can mean keen local mappers as much as many paths.
Named walking and hiking routes on OpenStreetMap with at least 300 m within 2 km of the town, longest first; national routes lead.
No named walking or hiking route is mapped near the town; local paths may simply not be on OpenStreetMap as routes.
Source: OpenStreetMap (route relations hiking, foot and walking), © OpenStreetMap contributors, ODbL. Trans Canada Trail sections as OSM maps them.
Environment and Climate Change Canada’s 1991–2020 normals from Vernon (6.8 km), and daylight at the town’s latitude. Good months: 12½+ hours of daylight, highs of 15–30 °C, little rain.
| Jan | Feb | Mar | Apr | May | Jun | Jul | Aug | Sep | Oct | Nov | Dec | |
|---|---|---|---|---|---|---|---|---|---|---|---|---|
| Daylight (h) | 8.5 | 10.0 | 11.7 | 13.7 | 15.4 | 16.4 | 16.0 | 14.5 | 12.5 | 10.6 | 8.9 | 8.0 |
| High (°C) | -1 | 3 | 9 | 15 | 21 | 24 | 28 | 28 | 22 | 12 | 5 | 0 |
| Rain & snow (mm) | 37 | 25 | 25 | 26 | 45 | 55 | 37 | 30 | 34 | 41 | 49 | 44 |
July is the warmest month, with highs around 28 °C; January the coldest, at -1 °C. Expect 55 mm in June, the wettest month, and 25 mm in March. Expect around 93 cm of snow over a winter. The climate in Electoral Area C, North Okanagan →
Beaches on OpenStreetMap within 5 km of the town’s edge, nearest first, with directions.
Another 2 have no name on the map. This page can’t show water quality: no open, Canada-wide record of beach testing exists. Check local advisories first.
Source: OpenStreetMap (natural=beach), © OpenStreetMap contributors, ODbL.
Viewpoints, peaks, waterfalls, picnic sites, nature reserves, playgrounds, dog parks, campsites and boat launches mapped within 2 km of the town.
Silver Star Mountain tops the hills nearby, 1,888 m. Playgrounds lead the count with 30.
Plus 3 viewpoints without a name on the map.
Plus 1 picnic site without a name on the map.
Plus 28 playgrounds without a name on the map.
Plus 1 dog park without a name on the map.
Plus 4 campsites without a name on the map.
Source: OpenStreetMap (tourism, natural, waterway and leisure tags), © OpenStreetMap contributors, ODbL.
The nearest places, coloured by the share of the land within 10 km that is protected; tap one for its outdoors page.
| Town | Protected within 10 km | Areas | Routes | Beaches |
|---|---|---|---|---|
| Electoral Area C, North Okanagan | 6.1% | 7 | 0 | 3 |
| Electoral Area B, North Okanagan 2.6 km | 3.7% | 17 | 0 | 30 |
| Vernon 5.2 km | 8.4% | 17 | 0 | 27 |
| Coldstream 6.5 km | 6.2% | 10 | 0 | 7 |
| Okanagan (Part) 1 13 km | 2% | 9 | 0 | 15 |
| Spallumcheen 14 km | 6% | 4 | 0 | 3 |
| Armstrong 17 km | 8% | 1 | 0 | 0 |
Its neighbours have no more than twice Electoral Area C, North Okanagan’s protected share.
The nearest is Mount Revelstoke National Park, 81 km away.
April to September: long days, mild highs and little rain.
Within 10 km, 6.1% of the land lies in protected areas.
Silver Star Park: 5,573 ha, a provincial park.
Kal Beach, 2.1 km from town, is the nearest mapped beach.
Silver Star Park, which reaches the edge of town.
Protected areas: Canadian Protected and Conserved Areas Database (CPCAD) 2.9.0, Environment and Climate Change Canada, 2026: every area within 10 km and the nearest national and provincial parks, measured outline to outline.
Walking routes and beaches: OpenStreetMap, November 2026: named hiking, foot and walking route relations within 2 km and beaches within 5 km.
Towns: Statistics Canada 2021 Census boundaries and populations; the comparison is the Canadian towns and neighbourhoods of 2,500+, not city hubs or reserves.
When to go: Environment and Climate Change Canada, Canadian Climate Normals 1991–2020, from the nearest station that publishes them.
Green space, paths, woods, things to do: OpenStreetMap (Geofabrik’s Canada extract), November 2026: parks, gardens, playing fields, woods, footpaths, the coastline and things to do in and around each town.
Residents: Statistics Canada 2021 Census dissemination areas (population, boundaries), each at a point inside it.
Walking routes and beaches © OpenStreetMap contributors, available under the Open Database Licence (ODbL).
Not on this page: trailheads and trail grades, and beach water quality. No open Canadian dataset gives these for every town yet.
Adapted from Statistics Canada (Census of Population 2021, population estimates 2025, 2021 census boundaries) under the Statistics Canada Open Licence; this does not constitute an endorsement by Statistics Canada. Neighbourhood names in some cities © OpenStreetMap contributors (ODbL).