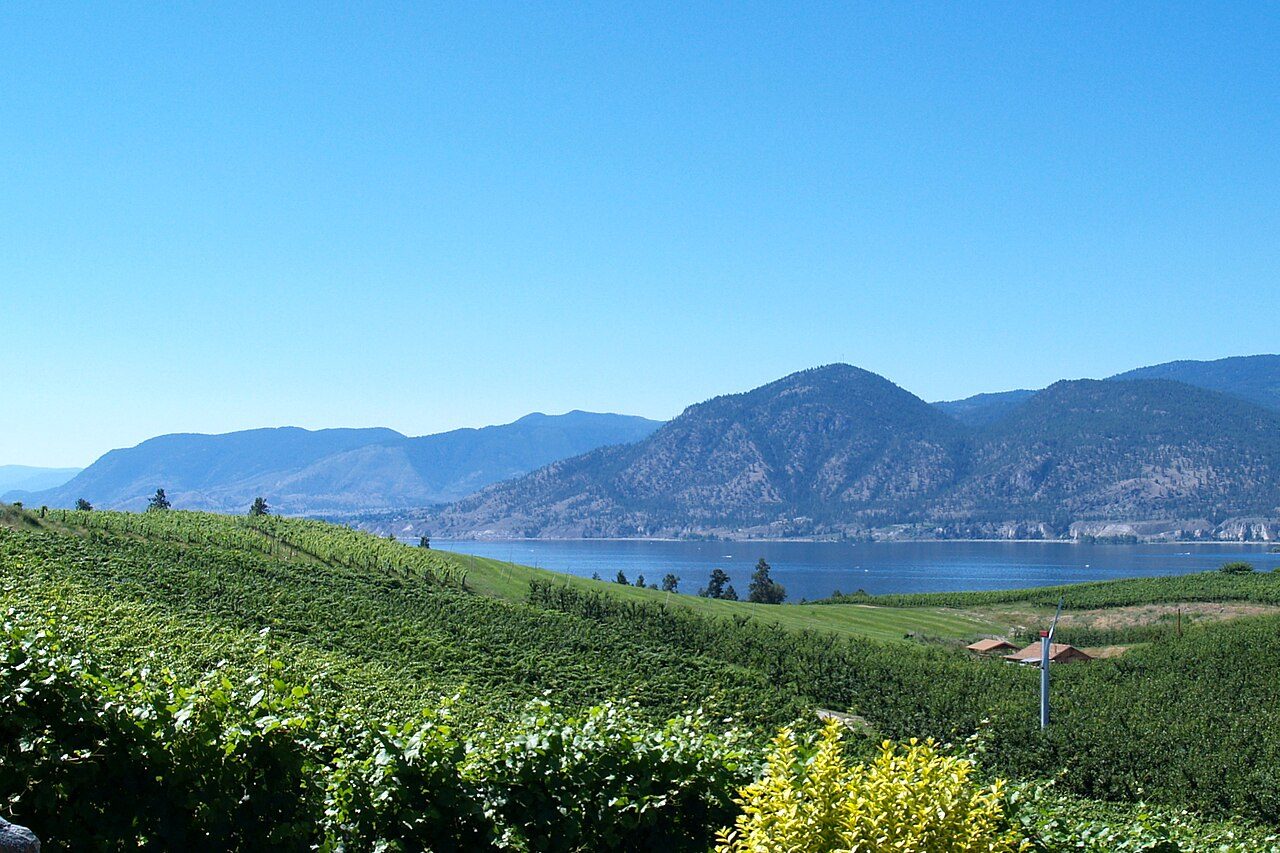
Naramatain Okanagan-Similkameen E, British Columbia
Home to 2,077 people, this town lies in British Columbia. Statistics Canada places it in the Okanagan-Similkameen census division.
Is Naramata a good place to live?
Where it does best is schools (A). Homes are dear (D). Natural hazards weigh more here (D−). Elsewhere it is close to typical: C+ for safety, B for health, B for jobs & income and B− for walkability.
Naramata has subject grades but no overall grade: Canadian towns get one from 2,500 residents.
This town's rent is the 2021 census rent scaled to 2025 by its province's ratio of surveyed to census rents: no rental survey covers it, so its Cost Grade is less sure. Safety less sure: no police service names this town, so its crime figure is the nearest police detachment's, shared with a wider area. Health is graded on the health region's survey figures and life expectancy, with the distance to hospital giving the town its own spread. Wildfire lowers this town's Hazard risk Grade: a high share of the land around it has burned in the last 40 years.
How Naramata grades
Each subject compares Naramata with Canadian towns of 2,500 or more, ordered by how far it is from the middle. Towns in other countries are graded separately.
Naramata has subject grades but no overall grade: Canadian towns get one from 2,500 residents.
How TownRatings grades Canadian towns →
What makes Naramata stand out
The 3 things Naramata does most differently from other towns.
The data
Data highlights are ordered by what stands out in Naramata.
Naramata earns a D− for hazard risk
Shared with the rest of the Okanagan health region: radon tests
Health Canada’s survey found radon above the guideline in 17% of homes, above British Columbia’s towns (1.8%) and Canadian towns (6.6%) alike. With 0.51% of the land around it burning each year, Naramata sits in the high wildfire band (19% within 25 km since 1986). Seismic risk runs low: $0.012 of expected damage per $1,000 of buildings a year, the typical town $0.030. Flood mapping exists: a study by Okanagan Basin Water Board.
Radon tests above the guideline · share of tested homes, 200 Bq/m³
| Hazards | Naramata | British Columbia | Canada |
|---|---|---|---|
| Radon tests above the guideline | 17% | 1.8% | 6.6% |
| Earthquake loss per $1,000 of buildings a year | $0.012 | $0.36 | $0.030 |
NRCan seismic risk model and burned areas, Health Canada radon survey, the Flood Hazard Map Inventory
3 boards run the schools in and around Naramata
Its 3 km reach takes in 8 elementary schools, 2 secondary schools, 2 schools for every grade and 3 alternative or adult schools, all of Naramata’s schooling. Results are mixed: 3 of 11 schools above the middle in British Columbia, 4 below it. Of the 15, 2 teach in French (2% of schools in British Columbia). From the town centre, high school starts 7.5 km away, above both British Columbia’s towns (1.8 km) and Canadian towns (1.2 km).
| School | Level | Students | System |
|---|---|---|---|
| Naramata Elementary Middle fifth in British ColumbiaIn NaramataElementary | Elementary | – | English public |
| Penticton Secondary Second fifth in British ColumbiaNearest secondary school, 1.8 kmSecondary | Secondary | – | English public |
| Secondaire de Penticton FrenchTeaches in FrenchSecondary | Secondary | – | French public |
| West Bench Elementary Top fifth in British ColumbiaResults in the top fifth in British ColumbiaElementary | Elementary | – | English public |
Schools by system · Schools within 3 km
| Schools within 3 km | Naramata | British Columbia | Canada |
|---|---|---|---|
| Nearest secondary school | 7.5 km | 1.8 km | 1.2 km |
| School boards | 3 | 2 | 3 |
Provincial school lists and results, 2025/26
Naramata is a town of owners: 85% of households own their home, above British Columbia’s towns and Canadian towns
Rent took 20% of household income, about level with Canadian towns (20%) and below British Columbia’s towns (24%). Shelter took 30% or more of income for 19% of households, below British Columbia’s towns (21%) and close to Canadian towns (18%).
What homes were worth · The median owner’s estimate at the 2021 census
| Census 2021 | Naramata | British Columbia | Canada |
|---|---|---|---|
| Households owning their home | 85% | 76% | 74% |
| Rent as a share of income | 20% | 24% | 20% |
| Households spending 30%+ on shelter | 19% | 21% | 18% |
Statistics Canada, Census 2021; CMHC Rental Market Survey via Statistics Canada · Values come from owners at the 2021 census and incomes from 2020, so they predate the later rise in rates.
Naramata has warmer summers than British Columbia’s towns or Canadian towns: July afternoons reach 29.2°C
Some 62 cm of snow falls in a typical year, above British Columbia’s towns (51 cm) but below Canadian towns (141 cm). On a January night, the temperature in Naramata falls to about −3.2°C. Between the last spring frost, 30 April, and the first in autumn, 8 October, lie 160 days. Rain and snow peak in June, at 44 mm.
Average high by season · ECCC normals, 1991–2020
| Normals, 1991–2020 | Naramata | British Columbia | Canada |
|---|---|---|---|
| July afternoon high | 29.2°C | 23.1°C | 25.5°C |
| Precipitation a year | 344 mm | 1,152 mm | 883 mm |
| January night low | −3.2°C | 0.5°C | −13.5°C |
| Days with frost a year | 109 | 60 | 159 |
Environment and Climate Change Canada, Canadian Climate Normals 1991–2020 (Penticton)
Older residents shape Naramata: 32% are 65 or over, above British Columbia’s towns and Canadian towns
Children under 15 count for just over a tenth of the people here. 5% of residents belong to a visible minority, below both British Columbia’s towns (8.6%) and Canadian towns (15%).
Ages · Share of residents in each age group, Census 2021
Schooling · Highest qualification, residents 15 and over
Women and men · all residents
Women make up 51.1% of Naramata
1,030 women and 985 men at the 2021 census; across Canada, women are 50.9%.
| Naramata | British Columbia | Canada | |
|---|---|---|---|
| Under 15 | 11% | 14% | 16% |
| 15 to 64 | 57% | 64% | 64% |
| 65+ | 32% | 21% | 19% |
| No certificate, diploma or degree | 7.9% | 13% | 16% |
| Postsecondary qualification | 64% | 56% | 56% |
Statistics Canada, Census 2021; British Columbia and Canada: medians of towns of 2,500+
Protected land around Naramata beats 9 in 10 Canadian towns
Public parks and reserves within 10 km: 26, higher than both British Columbia’s towns (14) and Canadian towns (4). No national park lies within 100 km. Inside the town itself, 18% of the land is protected. The Bat House Interpretive Trail is the one mapped walking route close by.
Protected land · of the land within 10 km
| Outdoors | Naramata | British Columbia | Canada |
|---|---|---|---|
| Protected land within 10 km | 13% | 6.7% | 2.3% |
| Public protected areas within 10 km | 26 | 14 | 4 |
Canadian Protected and Conserved Areas Database (CPCAD), OpenStreetMap routes and beaches
Around Naramata, 52% of adults call their health very good or excellent
The average trip from home to a hospital is 7.7 km, above British Columbia’s towns (4.4 km) and Canadian towns (3.7 km) alike. The region has more smokers than British Columbia, just over one in ten adults to 8.9%. Lives in the region last 81.0 years on average (2022/2024): 84.1 for women, 78.2 for men. Figures for health survey and life expectancy are published for the Okanagan Health Service Delivery Area as a whole, not for Naramata alone.
Very good or excellent health · adults, age-standardised
| Health | Naramata | British Columbia | Canada |
|---|---|---|---|
| Smokers | 12% | 9% | 12% |
| Chronic conditions (average share) | 16% | 15% | 17% |
| Very good or excellent health | 52% | 50% | 52% |
Statistics Canada, Canadian Community Health Survey 2023/2024 and life expectancy 2022/2024; Open Database of Healthcare Facilities
Naramata earns a C+ for safety
A best guess: the nearest detachment’s figures, since none is filed under Naramata
The violent index for its police area came to 64, lower than both British Columbia’s towns (76) and Canadian towns (86). Across the area its police cover, the Crime Severity Index averaged 72 over 2023–25, between British Columbia’s towns (83) and Canadian towns (67).
Year by year · Crime Severity Index for each year
| 2023–2025 | Naramata | British Columbia | Canada |
|---|---|---|---|
| Violent Crime Severity Index | 64 | 76 | 86 |
| Crime Severity Index | 72 | 83 | 67 |
Statistics Canada, Uniform Crime Reporting Survey, 2023–2025 average · Crime Severity Index, Violent Crime Severity Index, violent crime and property crime per 1,000: one figure for all of the Penticton detachment area
Naramata has 0.5 jobs for every resident in work, so most leave town for work
By car: that was how 90% of commuters travelled at the census. Commutes averaged 27 min, near both British Columbia’s towns (26 min) and Canadian towns (26 min).
How working residents got to work · census 2021
| Census 2021 | Naramata | British Columbia | Canada |
|---|---|---|---|
| Car or van | 90% | 87% | 89% |
| Average trip | 27 min | 26 min | 26 min |
Statistics Canada, Census 2021 (labour and commuting) · Counted in May 2021, under pandemic rules: fewer commutes and more people between jobs than in a normal year.
What November brings in Naramata: freezing at night, 7°C by day
A normal November brings 28 mm of rain and snow. Then December: 2°C by day, −3°C at night. Across the year, normals run from −3°C nights in January to 29°C afternoons in July. For today and the week ahead, the Weather page carries ECCC’s Summerland forecast.
Normal highs, the months ahead · ECCC normals, 1991–2020
| Season | High | Low | Rain and snow |
|---|---|---|---|
| Winter | 3°C | −3°C | 77 mm |
| Spring | 16°C | 3°C | 87 mm |
| Summer | 27°C | 12°C | 99 mm |
| Autumn | 15°C | 4°C | 82 mm |
ECCC normals, 1991–2020 (Penticton); the forecast is on the Weather page
Naramata’s voice in the Legislative Assembly of British Columbia is Amelia Boultbee
Naramata has no council of its own: it belongs to Okanagan-Similkameen E, a regional district electoral area.
Wikidata, MAMH, MMAH, Statistics Canada
Naramata’s public library is ORL: Naramata Branch
From the centre of Naramata, it is 2 km away.
Provincial library statistics, OpenStreetMap, the CRA and Statistics Canada
Everything we know about Naramata
Summerland Museum and Archives and 7 more in and around Naramata
A first look at Naramata’s museums, historic sites and days out, and a few just outside town.
 MuseumSicamous400 m outside town, to the southwest
 Historic shipNaramata400 m outside town, to the southwestMuseumMuseumPenticton Museum1.8 km outside town, to the southwestMuseumMuseumPeachland Museum1.6 km outside town, to the northTheme parkTheme parkLoco Landing Adventure Park600 m outside town, to the southwest
Photos: each place’s Wikidata image, from Wikimedia Commons under the licence below (our copy, resized).
Photo credits (2)
- Sicamous: Darren Kirby from Edmonton, AB, Canada, CC BY-SA 2.0, Wikimedia Commons
- Naramata: Joe Mabel, CC BY-SA 4.0, Wikimedia Commons
Famous people from around Naramata
No notable person born in Naramata is on our list; these were born in the towns around it.


Photo credits
Alexis Smith: Whitey Schafer, Public domain · Tyler Breeze: Miguel Discart from Bruxelles, Belgique, CC BY-SA 2.0 · Julia Ransom: Wikijunkie, CC BY-SA 3.0
About Naramata
Town in British Columbia
For Naramata, TownRatings uses Statistics Canada’s census-subdivision boundary in British Columbia, and every figure on its pages covers that whole area.
Statistics Canada: population estimates 2025 (17-10-0155), Census of Population 2021, 2021 census boundaries.
- Population
- 2,077 (people, 2025 estimate)
- Province or territory
- British Columbia
- Census division
- Okanagan-Similkameen
- Census subdivision
- 5907049
Naramata’s neighbours
The nearest places of 1,000 or more. Statistics Canada
| Town | People | km | Overall | Cost | Safety | Health |
|---|---|---|---|---|---|---|
| Naramata | 2,077 | — | — | D | C+ | B |
| Electoral Area F, Okanagan-Similkameen | 2,149 | 6.7 | — | C | C+ | B |
| Summerland | 12,343 | 7.5 | B | D− | B | B+ |
| Penticton | 39,068 | 12 | C | D− | D | B+ |
| Penticton 1 | 2,147 | 14 | — | — | — | B+ |
People: Statistics Canada, Census 2021. Distances: centre to centre.
Questions about Naramata
What kind of homes are in Naramata?
Mostly 93% single-detached houses (the median of Canadian towns: 64%), with 0% of homes in buildings of five or more storeys. Households hold 2.2 people on average, and 23% have just one.
Has Naramata grown?
Yes: the census counted 1,903 in 2016 and 2,015 in 2021, a rise of 5.9%, against 4.1% for the median of Canadian towns. The 2025 estimate is 2,077.
Sources: Statistics Canada, Census of Population 2021 · population estimates 2025 (17-10-0155) and 2021 census boundaries · Uniform Crime Reporting Survey 2023–25 (35-10-0026, 35-10-0183 to 35-10-0190) · CMHC rents as published by Statistics Canada (34-10-0133) · grades by TownRatings. Under the Statistics Canada Open Licence.
Adapted from Statistics Canada (Census of Population 2021, population estimates 2025, 2021 census boundaries) under the Statistics Canada Open Licence; this does not constitute an endorsement by Statistics Canada. Neighbourhood names in some cities © OpenStreetMap contributors (ODbL).