Health in Naramata · CCHS 2023/2024, Statistics Canada
Around Naramata, 52% of adults call their health very good or excellent
Lives in the region last 81.0 years on average (2022/2024): 84.1 for women, 78.2 for men. Closer to home, a hospital is 7.7 km from the average resident of Naramata, further than the usual 3.7 km. Health gives Naramata a grade of B.
British Columbia: 50% · Area-wide: very good or excellent health, chronic conditions, smokers and life expectancy, counted over the Okanagan Health Service Delivery Area
Chronic conditions
16%
arthritis, diabetes, high blood pressure: average share
Regions scoring 2.5 on the deprivation index typically live 82.9 years; Naramata’s region, at 81.0, falls short. For its deprivation ↓
Fewer households under strain
With a situational-vulnerability score of 1.2 out of 5, Naramata sits in the index’s least pressed areas. The wider area ↓
Survey and life expectancy: the health region (Statistics Canada). Distances and deprivation: the town’s own areas.
Health Grade
Naramata grades B for health
Each input ranked against Canadian towns of 2,500 or more: the region’s four, the town’s distance to a hospital.
Very good or excellent health (52%)Better than 54% of Canadian towns
Chronic conditions (16%)Better than 59% of Canadian towns
Smokers (12%)Better than 63% of Canadian towns
Life expectancy (81.0)Better than 55% of Canadian towns
Distance to a hospital (7.7 km)Better than 65% of Canadian towns
The region’s four figures and the town’s distance to a hospital are each ranked against Canadian towns of 2,500 or more, then averaged.
How the grade works
Health is graded as a regional score, labelled as such: very good or excellent self-rated health, chronic conditions (arthritis, diabetes and high blood pressure averaged) and smoking from the Canadian Community Health Survey, each age-standardised so an older region isn’t marked down for age alone, and life expectancy at birth, all for the health region. The residents’ average distance to a hospital is the one input measured for the town itself, so towns in one region can still differ.
For its deprivation
Behind regions as deprived by 1.9 years of life
One dot per health region, 102 in all, since life expectancy and the index are published for regions; Naramata’s dot is marked, under the line.
Situational vulnerability: residents’ average quintile, 1 least to 5 most deprivedLife expectancy at birth (years)
Set against 102 regions on the deprivation index (correlation −0.83), the region Naramata belongs to lives less long than its score of 2.5 predicts: 81.0 years, where the trend gives 82.9. The 10 regions scored most like it mostly do better (9 of 10), with a median of 82.9. The towns here bring in about $81,000 a household, below the typical region, while living longer than it; that is why income, which correlates at just 0.14 with life expectancy across regions, isn’t the measure.
Life expectancy: Statistics Canada table 13-10-0988, 2022/2024, by health region. Deprivation: Canadian Index of Multiple Deprivation 2021 (situational vulnerability), averaged over each region’s towns by their residents; income: 2021 Census median household income, averaged the same way. The averages and the line are TownRatings calculations.
The wider area
Life expectancy across the 16 health regions in British Columbia
Regional life expectancy in British Columbia, then the town’s place on the national deprivation index.
81.0
years at birth, 2022/2024
21.2
more years expected at 65
7th
longest of 16 regions in British Columbia
Life expectancy at birth by health region · 2022/2024
Richmond Health Service Delivery Area86.8
Fraser North Health Service Delivery Area84.4
North Shore/Coast Garibaldi Health Service Delivery Area84.3
Vancouver Health Service Delivery Area83.3
Fraser South Health Service Delivery Area83.2
South Vancouver Island Health Service Delivery Area82.7
Okanagan Health Service Delivery Area81.0
East Kootenay Health Service Delivery Area80.5
Fraser East Health Service Delivery Area80.0
Central Vancouver Island Health Service Delivery Area79.8
Kootenay-Boundary Health Service Delivery Area79.5
North Vancouver Island Health Service Delivery Area79.5
Thompson/Cariboo Health Service Delivery Area78.8
Northwest Health Service Delivery Area77.0
Northeast Health Service Delivery Area76.9
Northern Interior Health Service Delivery Area76.6
Ranked 7th of 16 in British Columbia: the regions span 76.6 to 86.8 years at birth.
Canadian Index of Multiple Deprivation · national quintile, 1 least to 5 most deprived
Residential instability2.0
Economic dependency4.7
Ethno-cultural composition2.1
Situational vulnerability1.2
The index is context and never graded: it describes Naramata’s own areas, averaged over residents, on each of its four dimensions.
Life expectancy: Statistics Canada table 13-10-0988, three-year estimate 2022/2024, by health region.
Conditions and habits
In the region, high blood pressure (23%) and diabetes (6.9%)
What the survey finds on conditions, weight and habits for the region, the province as the tick.
Conditions and weight · 2023/2024
High blood pressure
23%
Arthritis
25%
Diabetes
6.9%
Obese (self-reported)
28%
Mood disorder
16%
Anxiety disorder
14%
Habits · 2023/2024
Smoke daily or now and then
12%
Smoke every day
8.6%
Heavy drinking
25%
British Columbia
Self-reported obesity, 28%, tops British Columbia (25%). More adults drink heavily, 25% to the province’s 19%.
Canadian Community Health Survey 2023/2024 (table 13-10-0972), as published, not adjusted for age; obesity from reported height and weight. The anxiety disorder figure is the 2021/2022 estimate: Statistics Canada found the latest too unreliable to publish here.
Getting care
From Naramata, a hospital is 7.7 km away on average
Measured from where the town’s residents live, so this part is Naramata’s own, not the region’s.
Hospital
7.7 km
residents’ average distance
the typical Canadian town: 3.7 km
Clinic
8.3 km
community health centre or clinic, residents’ average
Pharmacy
8.4 km
residents’ average distance
0.0 within 3 km of a typical home
More than 30 km from a hospital
0%
share of residents
Emergency
911
police, fire, ambulance; 811 for health advice in most provinces
From Naramata that is further than the 4.4 km of the typical town in British Columbia, and the 3.7 km of the typical Canadian town.
The table’s survey and life-expectancy columns are one region’s, Naramata’s; read across for the hospital trip. Residents of Penticton live nearer a hospital, at 1.9 km against 7.7 km in Naramata.
How to read these numbers
What this data can and can’t tell you
•
What counts as a hospital. Facility locations come from Statistics Canada’s open database; records without coordinates sit at their postal code, and not every hospital has an emergency room.
•
Who the survey asks. The health survey leaves out people living on reserves, full-time Canadian Forces members, people in institutions, and Nunavik and the Cree lands of James Bay.
•
Regional figures. Statistics Canada reports the survey and life expectancy by health region, not by town: Naramata shares them with its neighbours, while the distances are measured for it alone.
•
Distances are straight lines. Each small census area is measured as the crow flies to the nearest facility and weighted by its 2021 residents, so real trips run longer.
•
Deprivation is context. The Canadian Index of Multiple Deprivation (2021) is context, never graded, and the territories have none.
•
Adjusted for age. Standardising for age lets a retirement region and a young one be set side by side; the charts keep the raw answers, the grade the standardised ones.
Questions about health in Naramata
How is Naramata’s Health Grade worked out?
Not so far; the grade arrives with Canada’s grading run and will set the region’s figures, plus Naramata’s own distance to care, against the typical Canadian town.
How far is Naramata from a hospital?
Beyond the hospital, the average home in Naramata is 8.3 km from a clinic and 8.4 km from a pharmacy.
What is the life expectancy in Naramata?
For the health region that includes Naramata, women can expect 84.1 years and men 78.2 (2022/2024).
How healthy is Naramata?
Taken together the region leans healthier than the typical Canadian town, but the picture is mixed. Chronic conditions there average 16% across arthritis, diabetes and high blood pressure.
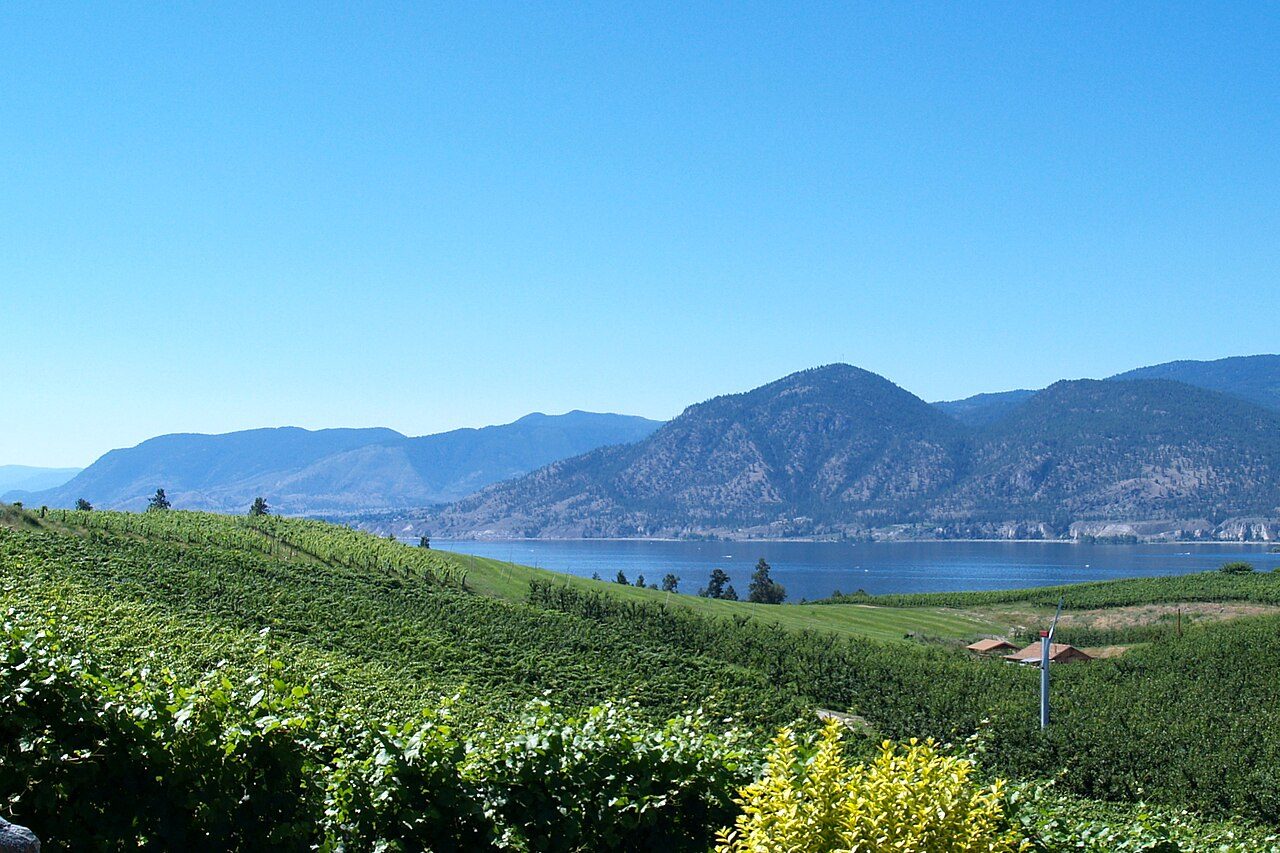 Photo: Jack Borno · CC BY-SA 3.0