98 years in pictures
Census counts: 1,434 in 1950, a low of 1,434 in 1950, 12,738 in 2020. The archive holds 10 old photos and papers going back to 2004 and 3 maps from 1947 on.
- 1928Big Bear City is settled
Each edition grades its towns against each other only.

Population 11,431: a town settled in 1928.
A tough set of grades. Hazard risk is its weak spot: FEMA rates its natural-hazard risk higher than 99% of U.S. communities, with inland flooding at the top. Big Bear City grades D overall, better than 11% of U.S. towns. That places it 601st of 841 in California. It lags on cost of living as well (D): the typical home is worth about $381K, 4.3 years of the Riverside metro’s $90K median household income. Where it does best is walkability — it is more walkable than 92% of U.S. towns. Incomes are weaker too (D): the median household income is $72K, and 16% of residents live below the poverty line. The biggest place to walk is San Bernardino National Forest, 20,408 acres with 124.5 miles of trail.
Figures: FEMA National Risk Index · home values, Zillow · incomes, Census ACS, 2020–24 · OpenStreetMap.
Where Big Bear City beats most towns, and one thing worth knowing.
60.2% of the town is conserved land, across 6 parks and preserves.
Each subject compared with towns across the country (schools within California), ordered by how far Big Bear City is from typical.
Its grades run from A for walkability (better than 92% of comparable towns) to D− for hazard risk (better than 1%), so the D overall blends very different results.
How TownRatings grades towns →
Census counts: 1,434 in 1950, a low of 1,434 in 1950, 12,738 in 2020. The archive holds 10 old photos and papers going back to 2004 and 3 maps from 1947 on.
Big Bear City is unincorporated, so San Bernardino County and regional agencies provide most services.
EPA SDWIS (Oct 9, 2026) · HIFLD + EIA-861 2025 · Census 2020 ZCTAs · NCES 2024–25 · registration: vote.gov, updated Nov 18, 2024.
Ordered by what stands out in Big Bear City.
Big Bear City is a second-home town, keeps more of its land conserved than most of California and has fewer 90° days than nearly all U.S. towns.
Its 12,276 conserved acres are a larger share of the town than in 99% of California towns.
Big Bear City’s trail density stands at 3.9 miles per square mile. In 6 parks and preserves, walkers have 125 miles of trail. Parks and preserves in the town: 6, covering 20,429 acres.
| Biggest places to walk | Trails | Acres |
|---|---|---|
| 1. San Bernardino National Forest | 124.5 mi | 20,408 |
| 2. Ranch Park | — | 10 |
| 3. Sugarloaf Park | — | 6 |
Trails & parks © OpenStreetMap contributors · Conserved land: USGS PAD-US
Its public schools are run by the Bear Valley Unified school district. Two of the 3 schools are below, and why each made the list. The largest public high school is Big Bear High, with 630 students.
| School | Level | Students | Letter |
|---|---|---|---|
| Baldwin Lane ElementaryLargest public elementary schoolGrades K–5 | Grades K–5 | 445 | B− |
| Big Bear HighLargest public high schoolGrades 9–12 | Grades 9–12 | 630 | A− |
NCES · EDFacts · graded within CA on state tests and graduation
Flood insurance has paid out on 4 claims in Big Bear City since 1993. FEMA puts 55% of the town’s expected hazard losses down to inland flooding, and 27% to earthquakes. Households in the town have drawn federal disaster aid in 5 declared disasters, most recently in 2023.
FEMA flood insurance claims · FEMA disaster declarations and aid · FEMA National Risk Index · OpenFEMA
The typical value, about $381K, is 18% below its July 2022 peak. At about $381K, home values are down 4% in five years, against a rise of 13% across California.
Typical home values fell 4.2% in the year to September 2026. Big Bear City’s typical rent stands at $1,854 a month, against $1,898 a month in California’s towns and $1,185 a month across U.S. towns. Homes sold in Big Bear City spent a median 91 days on the market.
| Big Bear City | California towns | U.S. towns | |
|---|---|---|---|
| Median rent | $1,854 a month | $1,898 a month | $1,185 a month |
| Households that own their home | 71% | 64% | 73% |
Census ACS, 2020–24 · Zillow Home Value Index · Redfin Data Center
Big Bear City has 992 jobs for its 6,832 working residents: even if every job went to a resident, most would still commute out. Jobs based here grew from 742 in 2013 to 992.
Just 7% of Big Bear City’s working residents have a job in town. Since 2013, Big Bear City has added 250 jobs, to 992 in 2023. Its typical household income stands at $72,000, where California’s towns sit at $95,000 and U.S. towns at $80,000. The share of workers in Big Bear City who work from home: 19%.
| Big Bear City | California towns | U.S. towns | |
|---|---|---|---|
| Below the poverty line | 16% | 10% | 9.6% |
| Work from home | 19% | 14% | 11% |
| Median household income | $72,000 | $95,000 | $80,000 |
| Average trip to work | 25 minutes | 28 minutes | 25 minutes |
Census LEHD 2023 · ACS
The Big Bear Lake weather station, 7 miles away, records that about 1 days a year reach 90°, fewer than in 96% of U.S. towns. January nights average 26.8°: milder than most of the country, but colder than 92% of California places with climate records; July afternoons average 81°.
In Big Bear City, the July high is 81°F. About 59 inches of snow falls in a winter.
| Big Bear City | California towns | U.S. towns | |
|---|---|---|---|
| July high | 81°F | 89°F | 85°F |
| January low | 27°F | 41°F | 22°F |
NOAA U.S. Climate Normals, 1991–2020
55.1% of homes are seasonal or vacation homes, against 2.4% statewide, which helps explain the older median age.
People 65 and older are 24% of residents (16% statewide); adults 18 to 34 are 16% of residents (24% statewide). Big Bear City’s midpoint age comes in at 47.2 years. Among adults 25 and older, 31% have a four-year degree or more, against 37% across California. For residents in the town, the share who are under 18 is 19%.
| Big Bear City | California towns | U.S. towns | |
|---|---|---|---|
| Median age | 47.2 years | 39 years | 40.5 years |
| Aged 65 or older | 24% | 16% | 18% |
| Under 18 | 19% | 22% | 22% |
48% women, 52% men
That’s an even split within the survey’s margin of ±2 points. Across California, 50.1% of residents are women.
| Big Bear City | CA | U.S. | |
|---|---|---|---|
| Under 10 | 10% | 11.4% | 11.6% |
| 10 to 17 | 8.7% | 10.5% | 10.3% |
| 18 to 24 | 6.5% | 9.1% | 9.1% |
| 25 to 34 | 9.7% | 14.8% | 13.7% |
| 35 to 44 | 12% | 13.9% | 13.2% |
| 45 to 54 | 12.6% | 12.5% | 12.2% |
| 55 to 64 | 16.6% | 12.1% | 12.7% |
| 65 to 74 | 15.7% | 9.2% | 10.2% |
| 75 and older | 8.1% | 6.5% | 7% |
| No diploma | 6.9% | 15.3% | 10.4% |
| High school | 28.6% | 20.5% | 26% |
| Some college | 24.7% | 19.3% | 19.1% |
| Associate’s | 9.1% | 7.9% | 8.8% |
| Bachelor’s | 21.5% | 22.7% | 21.6% |
| Graduate | 9.3% | 14.4% | 14.1% |
U.S. Census Bureau · ACS 2020-2024 5-year estimates
39 violent crimes were reported in 2025. Big Bear City's reported crime rate is close to California's. Its property offense rate stands at 15.1 per 1,000 residents.
| Big Bear City | California towns | U.S. towns | |
|---|---|---|---|
| Violent crimes per 1,000 (2025) | 7.7 per 1,000 residents | 2.9 | 1.6 |
| Property crimes per 1,000 (2025) | 15.1 per 1,000 residents | 13.3 | 9.9 |
FBI crime data, 2025 · crimes reported to police
Two figures for adults in Big Bear City: 74% had a checkup this year, 16% report frequent physical distress. This California town does better than the California average on 7 of 32 CDC measures and worse on 11. In Big Bear City, 38% of adults have high blood pressure.
| Big Bear City | California towns | U.S. towns | |
|---|---|---|---|
| High blood pressure (CDC PLACES) | 38% | 31% | 35% |
| Yearly checkup (CDC PLACES) | 74% | 72% | 79% |
| Frequent physical distress (CDC PLACES) | 16% | 14% | 14% |
| Fair or poor health (CDC PLACES) | 23% | 22% | 19% |
| What stands out | Big Bear City | CA |
|---|---|---|
| Fewer uninsured adults | 8.1% | 10.6% |
| Fewer adults facing housing insecurity | 12% | 14.9% |
| More adults with COPD | 7.9% | 5.1% |
CDC PLACES 2025 · modeled estimates for adults · CMS · HRSA
Museums, parks, gardens and other places to visit around Big Bear City. Close and well known come first.
Big draw23 mi National ParkJoshua Tree National Park2.9M visitors a year
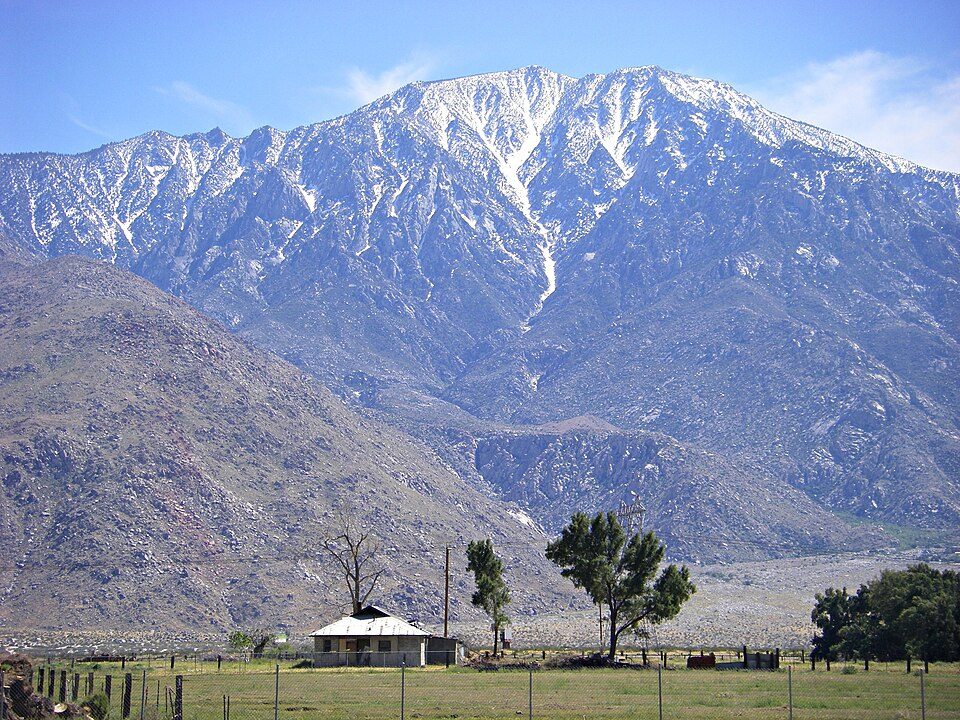
11 mi MountainSan Gorgonio Mountain
10 mi LakeBig Bear Lake
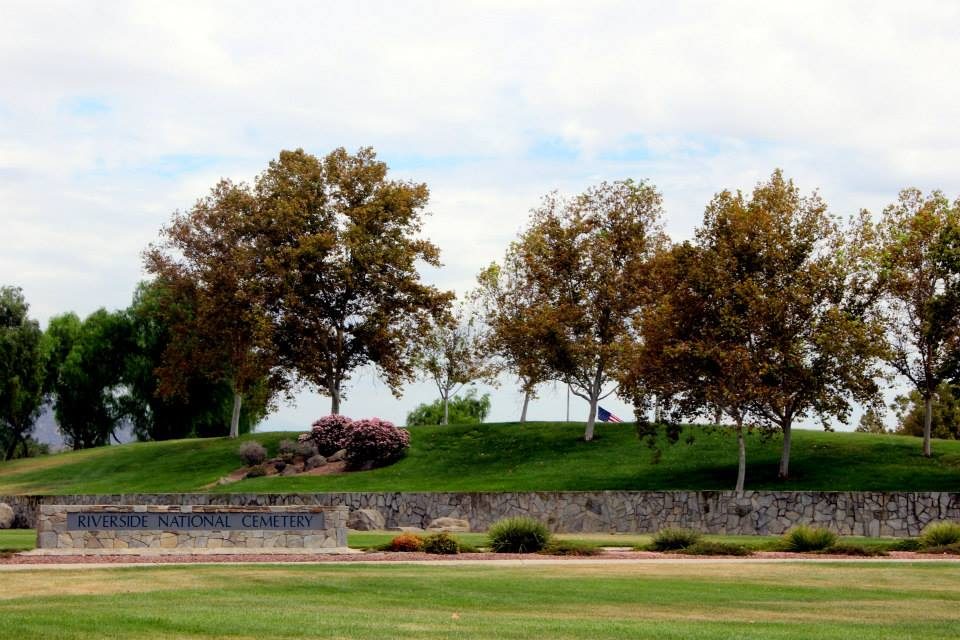
31 mi MountainSan Jacinto Peak36 mi LandmarkForest Lawn Cemetery
38 mi LandmarkRiverside National CemeteryJoshua Tree National Park: Sergiy Galyonkin, CC BY-SA 4.0 · San Gorgonio Mountain: Doc Searls, CC BY-SA 2.0 · Big Bear Lake: H.G. Judd, CC BY-SA 3.0 · San Jacinto Peak: Wattewyl, CC BY 3.0 · Riverside National Cemetery: Sigris Lopez, CC BY-SA 4.0
None within 15 miles of Big Bear City; the nearest are
About 3 of every 100 Big Bear City residents are enrolled in college, against 8 across California.
Where Big Bear City’s working residents go each day. Line width shows the share.
Census LEHD 2023
Census-designated place in California, United States
Big Bear City is an unincorporated community and census-designated place in San Bernardino County, California, United States along the east shore of Big Bear Lake and surrounded by the San Bernardino National Forest. It is 27 miles (43 km) northeast of the city of San Bernardino, and immediately east of the incorporated city of Big Bear Lake. Its population was 12,738 at the 2020 census, up from 12,304 at the 2010 census. Big Bear City is mostly residential, with smaller houses and cabins laid out in typical square block fashion. Big Bear is on the Pacific Crest Trail. Standard Air Lines of Los Angeles began a regular airline service to the community in the summer of 1929. Its post office w…
From Wikipedia, licensed CC BY-SA 4.0 · facts via Wikidata (CC0)
One town shares a border with Big Bear City.
| Town | CA rank | Overall | Cost | Safety | Schools | Health |
|---|---|---|---|---|---|---|
| Big Bear City | #601 | D | D | — | B | B− |
| Big Bear Lake | #436 | C | D | — | B | B |
Big Bear City and Big Bear Lake report no FBI crime data of their own. Compare Big Bear City with a neighbor →
Short answers, built from the data on this page.
Big Bear City grades D overall, better than 11% of U.S. towns and #601 of 841 in California. It grades B− for health and B for schools. Hazard risk is its weak spot, with a D−.
Yes. Cost of living, which also weighs rents, property taxes and how many households pay 30% or more of their income for housing, grades D.