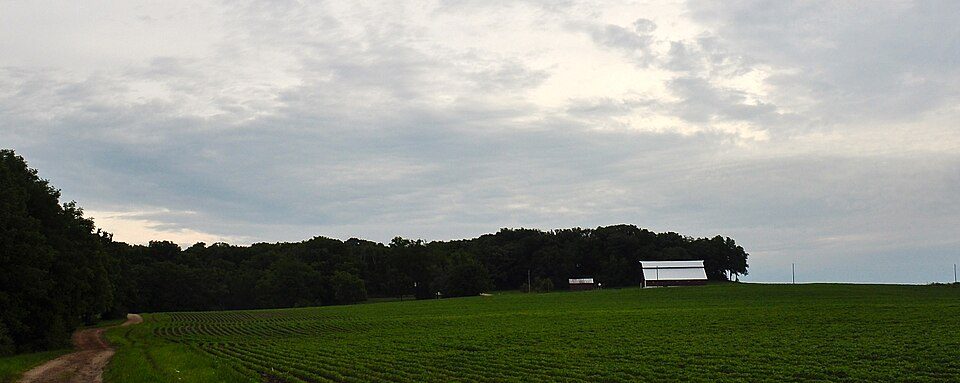
Hazel Green in pictures
Census counts: 723 in 1870, a low of 426 in 1890, 1,173 in 2020. The archive holds 12 old photos and papers going back to 1891 and a map from 1952 on.
Explore the history →Each edition grades its towns against each other only.

A town of 1,082.
21% of residents live below the poverty line in Hazel Green, above both the Wisconsin town median (6.4%) and the median of U.S. towns (9.6%). Among 363 Wisconsin towns, just 9 have a higher midpoint age than Hazel Green. We don’t grade Hazel Green yet; the figures below are still real.
In a town this size, neighbors are the best guide. Ask them anything.
Census counts: 723 in 1870, a low of 426 in 1890, 1,173 in 2020. The archive holds 12 old photos and papers going back to 1891 and a map from 1952 on.
Explore the history →Who provides power, water and the rest in Hazel Green, and how to reach them.
EPA SDWIS (Oct 9, 2026) · HIFLD + EIA-861 2025 · Census 2020 ZCTAs · NCES 2024–25 · registration: vote.gov, updated Nov 18, 2024.
Ordered by what stands out in Hazel Green.
Just over two in five adults 25 and older hold a bachelor’s degree or more in Hazel Green. People 65 and older are 37% of residents (19% statewide); adults 18 to 34 are 12% of residents (22% statewide).
| Hazel Green | Wisconsin towns | U.S. towns | |
|---|---|---|---|
| Bachelor’s degree or more, 25+ | 42% | 32% | 29% |
| Under 18 | 18% | 21% | 22% |
59.1% women, 40.9% men
About 69 men for every 100 women. Across Wisconsin, 49.9% of residents are women.
| Hazel Green | WI | U.S. | |
|---|---|---|---|
| Under 10 | 7.3% | 11.2% | 11.6% |
| 10 to 17 | 11.2% | 10.2% | 10.3% |
| 18 to 24 | 5.6% | 9.3% | 9.1% |
| 25 to 34 | 6.1% | 12.6% | 13.7% |
| 35 to 44 | 8.5% | 12.7% | 13.2% |
| 45 to 54 | 10.5% | 11.8% | 12.2% |
| 55 to 64 | 13.6% | 13.8% | 12.7% |
| 65 to 74 | 13.1% | 11.2% | 10.2% |
| 75 and older | 24.2% | 7.3% | 7% |
| No diploma | 5% | 6.4% | 10.4% |
| High school | 26.3% | 29.4% | 26% |
| Some college | 13.2% | 19.5% | 19.1% |
| Associate’s | 13.7% | 11.3% | 8.8% |
| Bachelor’s | 17.9% | 22% | 21.6% |
| Graduate | 24% | 11.4% | 14.1% |
U.S. Census Bureau · ACS 2020-2024 5-year estimates · in a town of 1,100, single groups can be off by several points
| School | Level | Students | Letter |
|---|---|---|---|
| St. Joseph Elementary School PrivateLargest elementary schoolGrades PK–8 | Grades PK–8 | 80 | – |
NCES · EDFacts
Compared with 81% of U.S. communities, expected storm and flood damage in Hazel Green is lower. Households in the town have drawn federal disaster aid in 5 declared disasters, most recently in 2017. Expected losses in Hazel Green break down as 35% from inland flooding and 20% from cold waves.
FEMA disaster declarations and aid · FEMA National Risk Index · OpenFEMA
The top destinations are Dubuque (31%), Hazel Green (5%) and Platteville (5%). Most working residents leave Hazel Green for work: only 3% work in town. Jobs in the town fell by 71 from 2013 to 2023, to 211. Its mean commuting time is 17 minutes.
| Hazel Green | Wisconsin towns | U.S. towns | |
|---|---|---|---|
| Average trip to work | 17 minutes | 22 minutes | 25 minutes |
| Working residents who work in town | 2.9% | 8.3% | 8% |
Census LEHD 2023 · ACS
Hazel Green’s peak summer temperature stands at 83°F, against 82°F in Wisconsin’s towns and 85°F across U.S. towns.
NOAA U.S. Climate Normals, 1991–2020
Hazel Green: 14% of adults report frequent physical distress. On the CDC’s 32 measures, Hazel Green is ahead of Wisconsin on 2 and behind on 5. In Hazel Green, just over two in five adults have obesity, and 29% feel lonely.
| Hazel Green | Wisconsin towns | U.S. towns | |
|---|---|---|---|
| Get no exercise (CDC PLACES) | 31% | 26% | 25% |
| Obesity (CDC PLACES) | 41% | 38% | 35% |
| Feel lonely (CDC PLACES) | 29% | 30% | 33% |
| Binge drink (CDC PLACES) | 18% | 20% | 16% |
| What stands out | Hazel Green | WI |
|---|---|---|
| Fewer adults facing housing insecurity | 8.3% | 9.7% |
| More adults treating high blood pressure | 80.6% | 77.8% |
| More adults who have had cancer | 10.4% | 8.6% |
CDC PLACES 2025 · modeled estimates for adults · CMS · HRSA
In 1 park or preserve, walkers have 5.1 miles of trail. Hazel Green’s trail network density comes in at 0.2 miles per square mile. One park or preserve covers 2 acres in the town.
| Biggest places to walk | Trails | Acres |
|---|---|---|
| 1. Point of Beginning Historic Marker | — | 2 |
Trails & parks © OpenStreetMap contributors · Conserved land: USGS PAD-US
Museums, parks, gardens and other places to visit around Hazel Green. Close and well known come first.
13 mi MountainCharles Mound
10 mi MuseumNational Mississippi River Museum & Aquarium250K visitors a year10 mi MuseumChicago Athenaeum
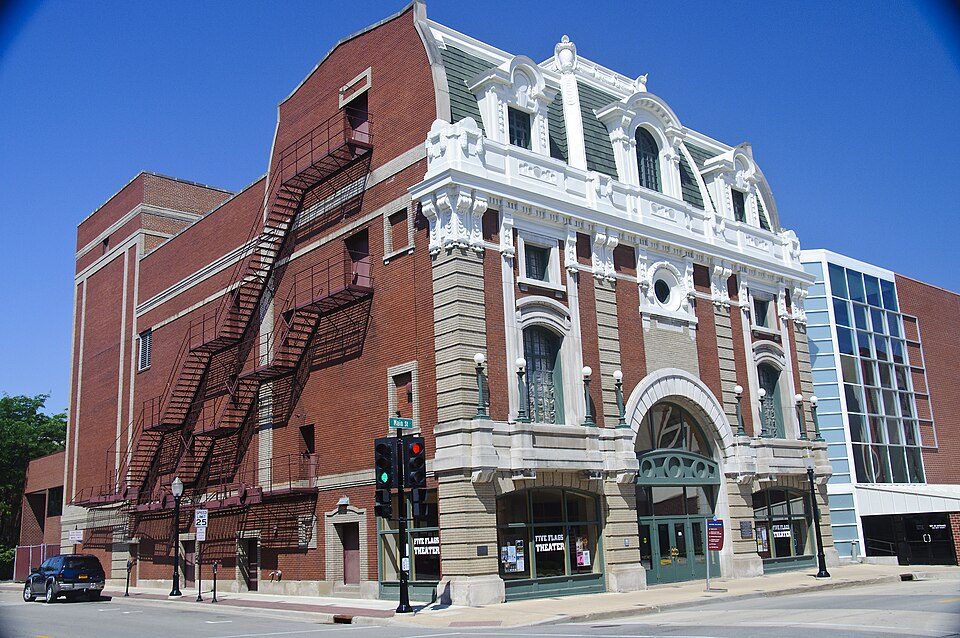
10 mi TheatreFive Flags Center10 mi MuseumDubuque Museum of Art
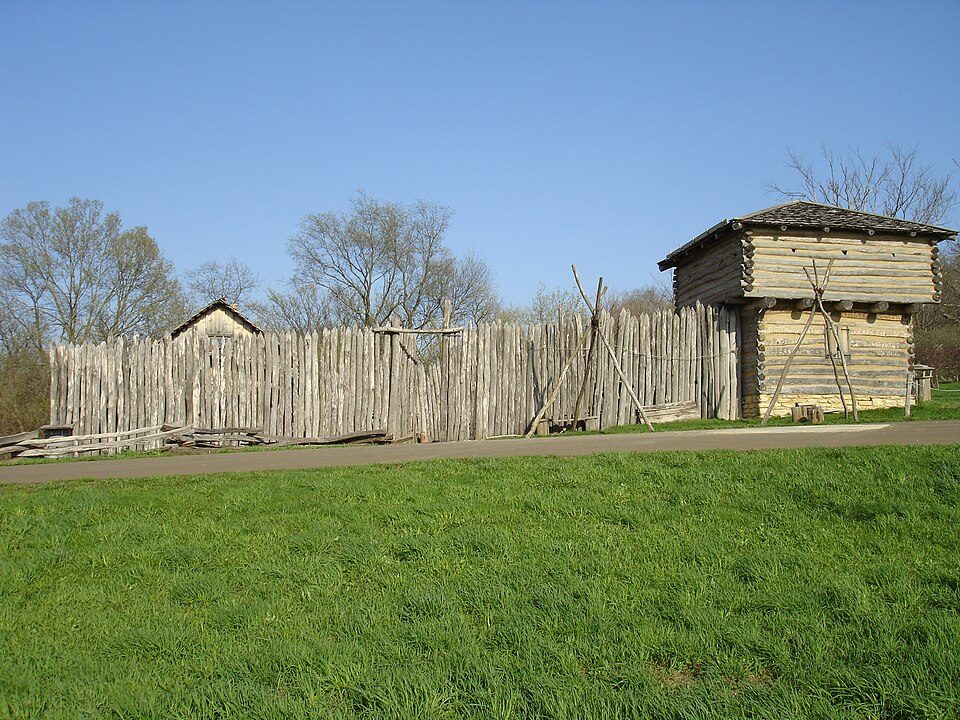
21 mi MuseumApple River FortCharles Mound: Skye Marthaler, CC BY-SA 3.0 · National Mississippi River Museum & Aquarium: Dirk Hansen, CC BY-SA 3.0 · Five Flags Center: Dirk Hansen, CC BY-SA 3.0 · Apple River Fort: IvoShandor, CC BY-SA 3.0
6 within 15 miles of the center of Hazel Green
About 3 of every 100 Hazel Green residents are enrolled in college, against 6 across Wisconsin.
Where Hazel Green’s working residents go each day. Line width shows the share.
Census LEHD 2023
4 notable people were born in Hazel Green.
Village in Wisconsin, United States
Hazel Green is a village in Grant and Lafayette counties in the U.S. state of Wisconsin. The population was 1,173 at the 2020 census. Of this, 1,151 were in Grant County, and only 22 were in Lafayette County. The village is located mostly within the Town of Hazel Green in Grant County; only a small portion extends into the Town of Benton in Lafayette County.
From Wikipedia, licensed CC BY-SA 4.0 · facts via Wikidata (CC0)
Short answers, built from the data on this page.
We don’t grade Hazel Green yet; the figures below are still real.