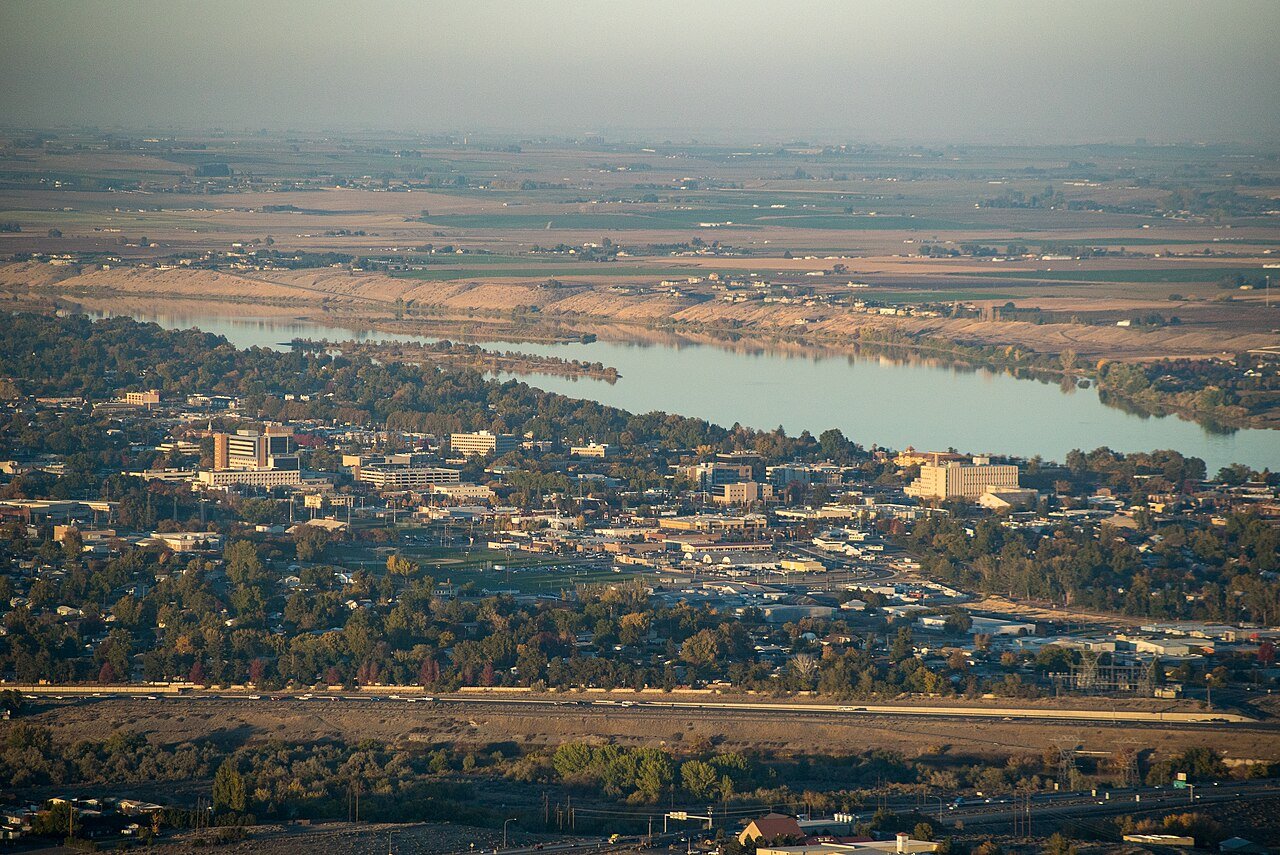
 Photo: Corbin Harder · CC BY-SA 4.0
Richland’s public schools outscore 75% of Washington districts
The grade covers the public school district serving Richland, from kindergarten through graduation, on state tests and graduation. In Richland, 60% of tested students read at a proficient level, above the Washington average (53%). Each state writes its own tests, so this is the one TownRatings grade compared within Washington, not nationally.
From Washington state tests taken in spring 2022, when 91% of students in the tested grades sat them, and the class of 2023’s four-year graduation rate, as reported to the U.S. Department of Education.
Richland’s schools, in brief
Above the state on both counts
Reading proficiency is 60% and math 45% in spring 2022, against 53% and 40% statewide; 84% of the class of 2023 graduated in four years, against 84%. Test scores ↓
Spending and class size
The district spends $16,240 per student, against $18,444 across Washington (FY2024). Spending doesn’t count toward the grade. Districts ↓
Eight elementary schools, then two middle and two high schools
Which school depends on the address at every step. Enrollment is up 6% since 2020–21. See the path ↓
Choice beyond the district
Liberty Christian School (private), Christ the King Catholic School (private), Children's Garden Montessori (private), Sagebrush Elementary School (private) and Sagebrush Montessori School (private) are in town. Pacific Crest Online Academy, an online school, is based here too; it isn’t counted as a local school. Every school ↓
Written from the figures on this page. Tests are from 2021–22, graduation from the class of 2023; each school’s own letter uses 2020–21 results.
What’s behind Richland’s grade
A−: better than 75% of Washington school districts, #87 of 285 Washington towns. Test scores and graduation are both above the Washington average; test scores are the stronger of the two.
Where will my kid go?
Pick a grade. These are the public schools that serve Richland, with each school’s own grade.
6th grade in Richland · depends on your address
Carmichael Middle School
Grades 6–8 · 791 students · 20:1 students per teacher
Chief Joseph Middle School
Grades 6–8 · 659 students · 19:1 students per teacher
7th grade in Richland · depends on your address
Carmichael Middle School
Grades 6–8 · 791 students · 20:1 students per teacher
Chief Joseph Middle School
Grades 6–8 · 659 students · 19:1 students per teacher
8th grade in Richland · depends on your address
Carmichael Middle School
Grades 6–8 · 791 students · 20:1 students per teacher
Chief Joseph Middle School
Grades 6–8 · 659 students · 19:1 students per teacher
9th grade in Richland · depends on your address
Richland High School
Grades 9–12 · 2,218 students · 23:1 students per teacher
Hanford High School
Grades 9–12 · 1,959 students · 23:1 students per teacher
10th grade in Richland · depends on your address
Richland High School
Grades 9–12 · 2,218 students · 23:1 students per teacher
Hanford High School
Grades 9–12 · 1,959 students · 23:1 students per teacher
11th grade in Richland · depends on your address
Richland High School
Grades 9–12 · 2,218 students · 23:1 students per teacher
Hanford High School
Grades 9–12 · 1,959 students · 23:1 students per teacher
12th grade in Richland · depends on your address
Richland High School
Grades 9–12 · 2,218 students · 23:1 students per teacher
Hanford High School
Grades 9–12 · 1,959 students · 23:1 students per teacher
Richland’s public schools are run by Richland School District, which also serves West Richland. Parts of Richland (7% of its land) are served by Kennewick instead. To confirm the school for a specific address, ask the district.
The district
Spending and class size are shown but don’t count toward the grade. Each district’s own page has every school.
Well above the state in reading
Richland vs. its neighbors
Schools grades for the Washington towns that share Richland’s borders.
| Town | Schools | Main districts |
|---|---|---|
| Richland | A− | Richland |
| Kennewick | C+ | Kennewick |
| West Richland | B+ | Richland PK–12 · Kiona-Benton City PK–12 |
| Pasco | C− | Pasco |
Every school in Richland
22 schools. Each public school’s letter compares its own 2020–21 reading and math results with Washington’s other public schools (the newest school-level results we have).
Left off: 1 public program with fewer than 25 students (Twin Rivers Group Home).
Questions about Richland’s schools
Are Richland’s schools good?
By Washington’s own tests, yes: the public schools Richland children attend outscore 75% of Washington’s school districts on tests and graduation, an A− Schools grade, #87 of 285 Washington towns. Among towns with similar incomes they beat 79%. Tests are from 2021–22, graduation from the class of 2023.
What school district is Richland in?
Richland School District, which runs grades PK–12 and enrolls 14,410 students in 22 schools (2024–25). Small parts of Richland are served by Kennewick.
Where do Richland kids go to high school?
One of 2 high schools, depending on your address: Richland High School and Hanford High School.
What is Richland’s graduation rate?
84% of the class of 2023 in Richland School District graduated in four years, against 84% across Washington.
How much does Richland spend per student?
$16,240 in Richland School District (FY2024), against $18,444 across Washington. Spending doesn’t count toward the grade.
Are there private schools in Richland?
Yes: Liberty Christian School (religious, grades PK–12, 589 students), Christ the King Catholic School (Catholic, grades PK–8, 459 students), Children's Garden Montessori (nonsectarian, grades PK–4, 148 students), Sagebrush Elementary School (nonsectarian, grades PK–6, 97 students) and Sagebrush Montessori School (nonsectarian, grades PK–K, 50 students).
Parents talk
What Richland families are saying about school.
Looking for colleges? Colleges near Richland → They have their own page.
School data: state test results (2021–22, with participation) and four-year graduation rates (class of 2023) reported to the U.S. Department of Education (EDFacts via ED Data Express); each school’s own letter uses its 2020–21 results (EDFacts via the Urban Institute); schools and enrollment from NCES (2024–25; private schools 2023–24); spending from the Census Bureau’s school finance survey (FY2024). The School Grade is our own summary, graded within Washington. Stars are from neighbors.