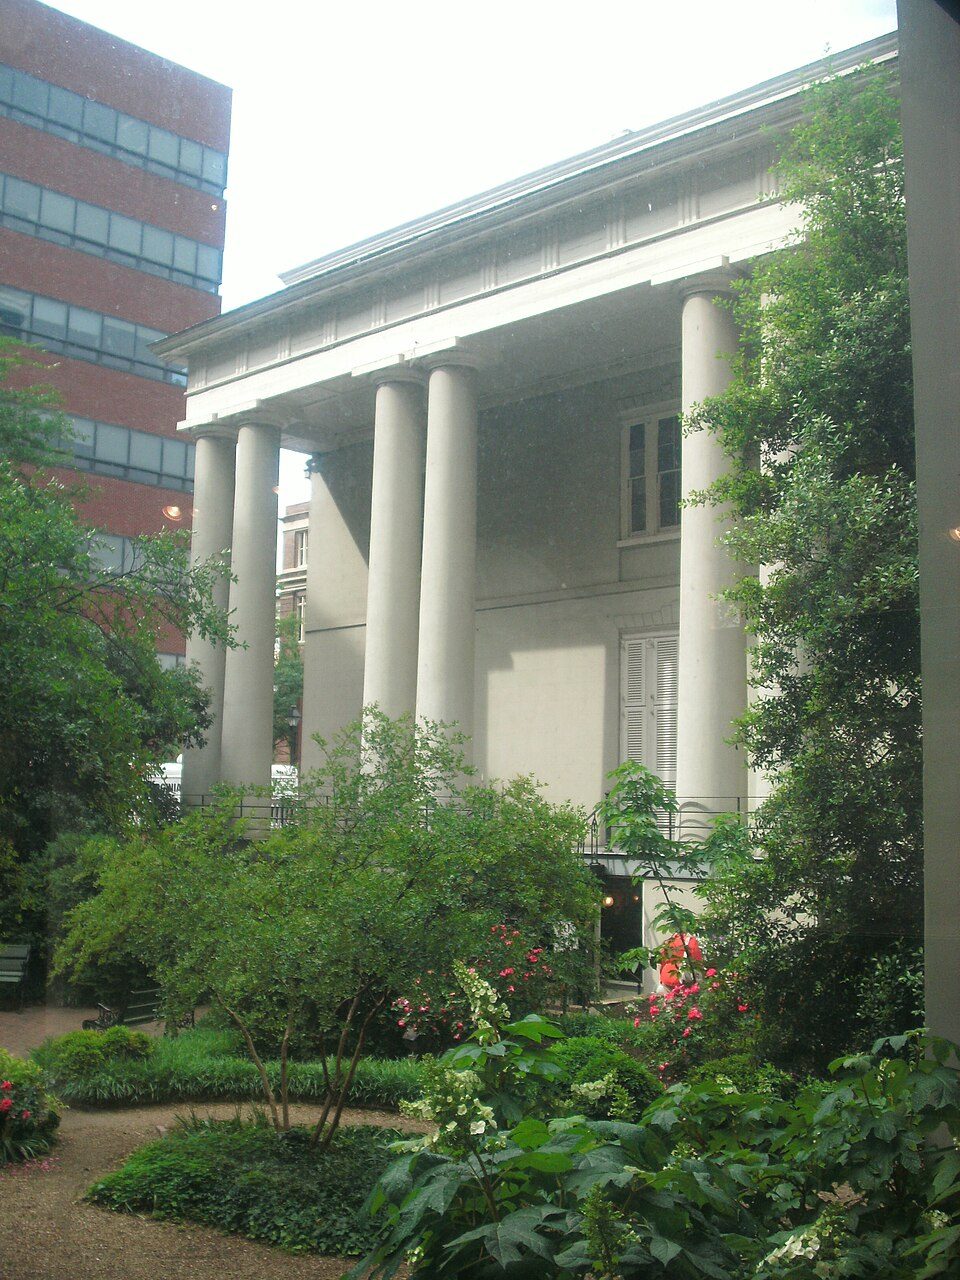
Montrose in pictures
Census counts: 5,349 in 1980, 7,909 in 2020. The archive holds 1 old photo or paper and 7 maps from 1894 on.
1 place on the National Register of Historic Places.
Explore the history →Each edition grades its towns against each other only.

A town of 8,285.
Montrose's standout: natural-hazard risk is low. Overall it grades C, ranked 203rd of 249 in Virginia. Its weakest subject is health: residents are less healthy than 83% of U.S. towns on CDC estimates. Montrose’s trail density is 1.6 miles per square mile, above both Virginia’s towns (0.7) and U.S. towns (0.4). Richmond National Cemetery and Dabbs House is on the National Register of Historic Places. Montrose is more walkable than 70% of U.S. towns.
Where Montrose beats most towns.
Where Montrose’s working residents go each day. Line width shows the share.
Census LEHD 2023
Each subject compared with towns across the country (schools within Virginia), ordered by how far Montrose is from typical.
How TownRatings grades towns →
Census counts: 5,349 in 1980, 7,909 in 2020. The archive holds 1 old photo or paper and 7 maps from 1894 on.
1 place on the National Register of Historic Places.
Explore the history →Museums, parks, gardens and other places to visit around Montrose. Close and well known come first.
5 mi LandmarkHollywood Cemetery
22 mi Theme parkKings Dominion
3 mi MuseumWhite House of the Confederacy
5 mi LandmarkRobert E. Lee Monument
4 mi Stadium & arenaRichmond Coliseum
6 mi MuseumVirginia Museum of Fine Arts411K visitors a yearHollywood Cemetery: Andrew Bain, Public domain · Kings Dominion: Erechtheus, CC BY-SA 3.0 · White House of the Confederacy: AlbertHerring, CC BY-SA 3.0 · Robert E. Lee Monument: Martin Falbisoner, CC BY-SA 3.0 · Richmond Coliseum: Mentes at en.wikipedia, CC BY-SA 3.0 · Virginia Museum of Fine Arts: Virginia Museum of Fine Arts, CC BY-SA 4.0
Montrose is unincorporated, so Henrico County and regional agencies provide most services.
EPA SDWIS (Oct 9, 2026) · HIFLD + EIA-861 2025 · Census 2020 ZCTAs · NCES 2024–25 · registration: vote.gov, updated Sep 30, 2026.
Ordered by what stands out in Montrose.
Montrose is healthier than towns with similar incomes and has homes that are cheap against local pay, but it has poverty well above the Virginia rate.
In the comparison, Montrose comes below both the Virginia town median (4.7%) and the median of U.S. towns (4.3%). 5.1 miles of trail in 0 parks and preserves.
Trails & parks © OpenStreetMap contributors · Conserved land: USGS PAD-US
Its public schools are run by the Henrico County Public Schools. Its one school is below.
| School | Level | Students | Letter |
|---|---|---|---|
| Montrose ElementaryLargest public elementary schoolGrades PK–5 | Grades PK–5 | 341 | D |
NCES · EDFacts · graded within VA on state tests and graduation
Expected storm and flood damage is lower than in 90% of U.S. communities. Since 2003, 3 flood insurance claims have been paid out in Montrose.
FEMA flood insurance claims · FEMA National Risk Index · OpenFEMA
Against the 5,620 U.S. towns with household incomes like Montrose’s, it is less healthy than 57%, so its C− isn’t only a matter of income.
44% of adults sleep under 7 hours in Montrose. Montrose beats the Virginia average on 2 of 32 CDC measures and trails it on 20. 12% of adults binge drink in Montrose.
| Montrose | Virginia towns | U.S. towns | |
|---|---|---|---|
| Sleep under 7 hours (CDC PLACES) | 44% | 36% | 36% |
| High blood pressure (CDC PLACES) | 43% | 33% | 35% |
| Diabetes (CDC PLACES) | 16% | 11% | 12% |
| Binge drink (CDC PLACES) | 12% | 14% | 16% |
| What stands out | Montrose | VA |
|---|---|---|
| Fewer adults who have had cancer | 6% | 7.7% |
| Fewer binge drinkers | 11.5% | 14.5% |
| More adults facing a utility shut-off | 14.1% | 7.1% |
CDC PLACES 2025 · modeled estimates for adults · CMS · HRSA
At 2.9 years of the Richmond metro’s $87K median household income, the typical home (about $256K) costs less against local pay than in 93% of Virginia towns; that ratio is one input to its B for cost of living. Home values rose 45% in five years, to about $256K, against 23% across Virginia.
The typical Montrose home is worth about $256,000, up 2.2% in a year, 38% below the Virginia typical home. Montrose’s median rent is $1,297 a month.
| Montrose | Virginia towns | U.S. towns | |
|---|---|---|---|
| Households that own their home | 38% | 68% | 73% |
| Median rent | $1,297 a month | $1,764 a month | $1,185 a month |
Census ACS, 2020–24 · Zillow Home Value Index · Redfin Data Center
The average commute for its 3,626 working residents takes 19.2 minutes, against 27.3 across Virginia.
Most working residents leave Montrose for work: only 1% work in town. 20% of Montrose residents live below the poverty line. The top destinations are Richmond (25%), Mechanicsville (4%) and Sandston (4%).
| Montrose | Virginia towns | U.S. towns | |
|---|---|---|---|
| Below the poverty line | 20% | 7.7% | 9.6% |
| Median household income | $50,000 | $102,000 | $80,000 |
| Average trip to work | 19 minutes | 27 minutes | 25 minutes |
| Work from home | 6.4% | 18% | 11% |
Census LEHD 2023 · ACS
Montrose has mild winters and warm summers. The July high in Montrose is 90°F.
NOAA U.S. Climate Normals, 1991–2020
9 within 15 miles of the center of Montrose
About 7 of every 100 Montrose residents are enrolled in college, about the same as Virginia.
Census-designated place in Virginia
Montrose is a census-designated place (CDP) in Henrico County, Virginia, United States. The population was 7,909 at the 2020 census.
From Wikipedia, licensed CC BY-SA 4.0 · facts via Wikidata (CC0)
2 towns share a border with Montrose.
| Town | VA rank | Overall | Cost | Safety | Schools | Health |
|---|---|---|---|---|---|---|
| Montrose | #203 | C | B | — | C+ | C− |
| Richmond | #236 | D | C− | D | D− | B− |
| Sandston | #191 | C+ | B | — | C+ | C− |
Montrose and Sandston report no FBI crime data of their own. Compare Montrose with a neighbor →
Short answers, built from the data on this page.
Montrose grades C overall, better than 32% of U.S. towns and #203 of 249 in Virginia. It grades C− for health and C+ for schools. Health is its weak spot, with a C−.
That is 2.9 years of the area's median household income ($86,679 across the Richmond, VA metro area). Cost of living, which also weighs rents, property taxes and how many households pay 30% or more of their income for housing, grades B.