Guest, Sign inJoin
View towards Port Talbot Town Centre
UK›West Glamorgan›Wales

Port TalbotWest Glamorgan

TownGrade
D
#17 of 19 in West Glamorgan

Population 31,557: a large town in West Glamorgan, Wales.

7 places within 12 milesMap →
Photo: David Hillas · CC BY-SA 2.0
View towards Port Talbot Town Centre

Port Talbot, West Glamorgan · Photo: David Hillas · CC BY-SA 2.0

Is Port Talbot a good place to live?

The data are hard on it. Where it falls short is health (D−) — 9.8% of residents report bad or very bad health, and 26.4% are disabled. Port Talbot ranks #17 of 19 in West Glamorgan, with a D overall. Set against the rest, it does better than nearly a tenth of UK towns. Its best grade is for cost of living — homes sell for a median £153,000, about 3.6 times local household income. It also trails on safety: 48.8 violent or sexual offences per 1,000 residents a year, plus 14.2 home and vehicle crimes. Only 18% of UK towns of 10,000 to 50,000 people have more crime per resident. Jobs & income is weaker too — mean household income £38,921; 4.1% of 16 to 64s claim unemployment benefits.

Figures: prices, HM Land Registry, the last three years · health, Census 2021 (the grade adjusts for age) · crime, police.uk, averaged Sep 2023 to Aug 2026 · income, ONS · claimants, DWP.

This town's Health Grade uses ONS's small-area life expectancy and healthy life expectancy for 2019 to 2023, and two Census 2021 measures, bad health and disability, adjusted for age. English towns' grades also use OHID's small-area early deaths, hospital admissions and child obesity, which OHID publishes for England only.

How Port Talbot grades

Each subject compared with the 2,160 UK towns with an overall grade (schools within Wales), ordered by how far Port Talbot is from typical. American towns are graded separately.

How grading works
Character Graded, but not part of the overall grade.

How TownRatings grades towns →

What makes Port Talbot stand out

The 3 things Port Talbot does most differently from other towns.

Picked automatically from the data
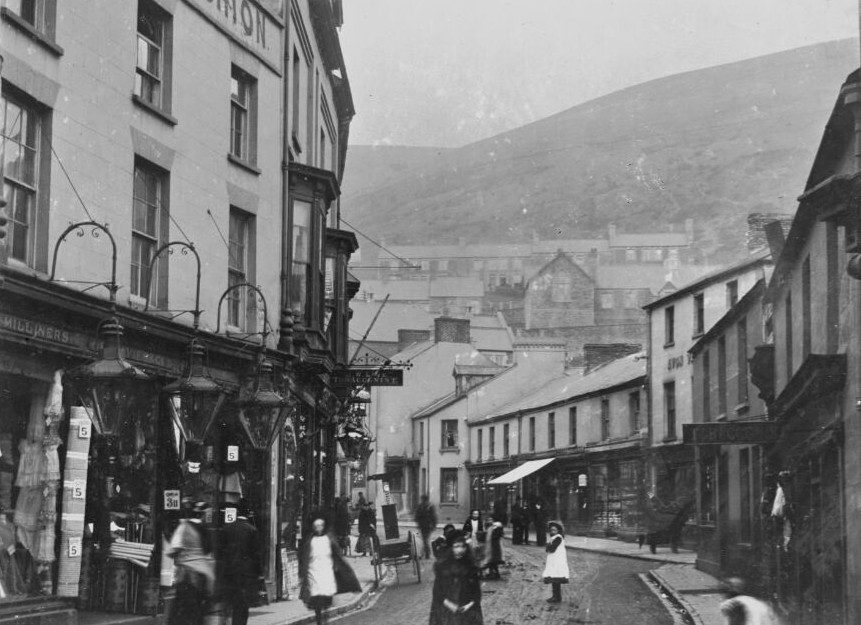
High Street, Port Talbot II
High Street, Port Talbot II, 1905 · Photo: National Library of Wales · Public domain
Port Talbot’s story

Port Talbot in pictures

Cadw lists 32 buildings inside Port Talbot’s built-up area, 4 of them Grade II*.

26% of its homes were built before 1919, against 15% in the typical UK town.

The archive holds 3 old photos and postcards going back to 1905.

  • 1905Jersey Beach Hotel, Port Talbot
  • 1905The Esplanade, Port Talbot
Explore the history →

Landmarks

32 listed buildings in Port Talbot.

All landmarks →
Photo credits

Beulah Calvinistic Methodist Chapel: Photo: Jaggery · CC BY-SA 2.0 · Church of St Theodore: Photo: John Lord · CC BY-SA 2.0 · War Memorial: Photo: Sean Pursey · CC BY-SA 3.0 · Aberavon Bridge (partly in Aberavon community): Photo: FruitMonkey · CC BY-SA 4.0

The data

Data highlights are ordered by what stands out in Port Talbot.

Health

Port Talbot’s life expectancy trails 95% of UK towns

74%good or very good healthD−Health Grade

At the census, 74% of people in Port Talbot called their health good or very good, lower than both West Glamorgan’s towns (78%) and Wales’s towns (78%). A disability affects 26% of people in the town. Also worth knowing: 4 GP practices serve the town. The nearest A&E to Port Talbot is Morriston Hospital, 8.7 miles away.

General health, self-reported
Good or very good 74%Fair 16%Bad or very bad 10%
Census 2021Port TalbotWest GlamorganWales
Good or very good health74%78%78%
Bad or very bad health9.8%7.9%7.1%
Disabled (Equality Act)26%23%22%
75.4
life expectancy at birth, men (2019–23)
79.9
life expectancy at birth, women
Welsh towns’ Health Grades use ONS’s small-area life expectancy and healthy life expectancy for 2019 to 2023, and two Census 2021 measures, bad health and disability, adjusted for age. English towns’ also use OHID’s small-area early deaths, hospital admissions and child obesity, which OHID publishes for England only.

ONS Census 2021, general health and disability · ONS, life expectancy 2019–23 · OGL · A young population flatters these answers, which are not age-adjusted; the Health Grade instead uses measures that allow for age, such as life expectancy.

Schools

13 state schools in Port Talbot

Port Talbot’s ten primaries and three secondaries have 6,136 pupils between them. Below are three of them, each with why it was picked. Three of them are below, each with the reason it’s listed.

SchoolLevelPupilsLetter
Tywyn Primary SchoolLargest primary schoolPrimaryPrimary439–
Ysgol Cwm BrombilLargest secondary schoolAll-throughAll-through1,439–
YGG Rhos-AfanLargest Welsh-medium schoolPrimaryPrimary388–
Welsh Government · schools list · Wales publishes no school-level results, so its schools have no letters.See all 13 schools →
Safety

More crimes per resident in Port Talbot than in 90% of UK towns

48.8violent and sexual offences per 1,000 a yearDSafety Grade

Town centres with shops, stations and nightlife record more crime per resident: police.uk counts crimes where they happen, not where victims live.

Port Talbot logged 3,075 reported offences in a year (to August 2026), plus 545 complaints of anti-social conduct. Among the 645 UK towns of 10,000 to 50,000 people, Port Talbot has more crime per resident than just over four fifths of them. Anti-social behaviour, shown but not graded, came to 17.2 reports per 1,000, above both West Glamorgan’s towns (7.8) and Wales’s towns (10.4). Of all the crimes, 47% were violence and sexual offences.

Compared with UK towns its sizeLess crime per resident than 18% of the 645 UK towns of 10,000 to 50,000 people: more crime than most for its size. Context only, not part of the grade.

Reports by type · Sep 2025 to Aug 2026

Violence & sexual1,432
Public order445
Shoplifting373
Damage & arson265
Other theft175
Vehicle crime91
Other crime82
Burglary69
Anti-social545

Not gradedAnti-social behaviour, shoplifting and other theft are shown but left out of the Safety Grade, which counts violence and crimes against homes and vehicles per resident.

48.8
violent and sexual offences per 1,000 residents a year, averaged Sep 2023 to Aug 2026
14.2
burglary, vehicle crime and damage per 1,000 a year, averaged Sep 2023 to Aug 2026
17.2
anti-social behaviour reports per 1,000 (not graded)
3,075
crimes recorded in the 12 months to August 2026

data.police.uk street-level crime · points inside the ONS built-up-area boundary · OGL · The police category of violence and sexual offences includes harassment and stalking.

HousingCost of living grade B+

Fewer households own their home in Port Talbot than in West Glamorgan’s towns or across Wales’s towns: 59%

£153Kmedian sale

Social housing holds nearly a quarter of households, above West Glamorgan’s towns (19%) and Wales’s towns (18%) alike. From September 2023 to August 2026, 1,083 homes sold inside Port Talbot’s built-up area at standard prices; the middle one went for £153,000. Private rents average £690 a month across the Neath Port Talbot council area.

Median sale price · Sep 2023 to Aug 2026

Port Talbot£153K
Typical UK town£277K
By typeMedianSales
Detached£274,995107
Semi-detached£166,000447
Terraced£129,000479
Flat or maisonette£146,75050
59%
of households own their home · Wales 65%
£690
average private rent a month, Neath Port Talbot council area
£2,541
council tax, Band D, 2026–27

HM Land Registry Price Paid · ONS private rents · MHCLG / Welsh Government council tax · ONS Census 2021 tenure · OGL

Work & commuteJobs & income grade D

Work is close at hand in Port Talbot: 50% of commuters travel under 5 km, more than in West Glamorgan’s towns and across Wales’s towns

16%walk, cycle or ride

The Census was taken on 21 March 2021, in lockdown, so 18% of workers were mainly at home; shares here are of those who travelled.

45% of commuters who live in Port Talbot also work there. Working mainly from home: 18% of workers, lower than both West Glamorgan’s towns (23%) and Wales’s towns (24%). This West Glamorgan town counts 1.4 jobs per working resident.

How commuters got to work · March 2021

Driving81%
On foot10%
Bicycle3%
Bus2%
Train1%
50%
of commuters travel under 5 km · Wales 41%
18%
worked mainly from home in March 2021
£39K
mean household income, before tax
4.1%
of 16 to 64s claim unemployment benefits (2026)
B
Walkability: more walkable than 62% of UK towns

ONS Census 2021, method of travel and distance to work · ONS small-area income · DWP claimant count · OGL

History

Listed buildings in Port Talbot: 32

32listed buildingsBHistory Grade

The heritage lists give each building’s grade but not its age, so we don’t say which is oldest.

Grade II* covers 4 of them. The register of parks and gardens lists one in Port Talbot.

Listed buildings by grade · Cadw

Grade I0
Grade II*4
Grade II28

Among them · Grade II*

0
scheduled monuments
1
registered park and garden
26%
of homes built before 1919 · typical UK town 15%
10
listed buildings per 10,000 residents · typical UK town 24

Cadw list, October 2026 · Valuation Office Agency, homes by build period · OGL

Who lives here

Degrees are less common in Port Talbot than in West Glamorgan’s towns or across Wales’s towns: 22% of adults

42median age

Young adults of 15 to 24 are 10% of the population. 18% are under 15, above both West Glamorgan’s towns (16%) and Wales’s towns (17%). Port Talbot has a median age of 42.

Port TalbotWest GlamorganWales

Ages · share of residents

Qualifications · residents 16 and older

No qualifications28%
Apprenticeship6%
A levels or similar16%
Degree level22%

Women and men · all residents

51% women, 49% men

About 94 men for every 100 women. Across Wales, 51% of residents are women.

Ages and qualifications in Port Talbot
Port TalbotWest GlamorganWales
Under 1518%16%17%
15–2410%13%12%
25–4426%24%25%
45–6426%26%26%
65+20%21%21%
No qualifications28%21%20%
Apprenticeship5.9%6.1%5.6%
A levels or similar16%18%17%
Degree level22%30%31%

ONS Census 2021 · West Glamorgan and Wales: all residents of their built-up areas · OGL

Keep exploring

Everything we know about Port Talbot

15pages on Port Talbot
Nearby attractions

Aquasplash Play Pool and 10 more in and around Port Talbot

Museums, castles, gardens and days out in and near Port Talbot. Best known first.

All attractions →
Places: © OpenStreetMap contributors · Wikidata

Photos: each place’s Wikidata image, from Wikimedia Commons under the licence below (our copy, resized).

Photo credits (5)

Famous people from Port Talbot

9 notable people were born in Port Talbot.

See all 9 →
Photo credits

Dic Penderyn: John Lord, CC BY-SA 2.0

About Port Talbot

Large town in West Glamorgan, Wales

Port Talbot is a built-up area of 31,557 people, in the Neath Port Talbot council area. TownRatings uses ONS’s 2022 built-up areas as towns: the physical town, as people mean the word, rather than a council district, so its figures cover the town itself.

Built from ONS geography and Census 2021

Population
31,557 (Census 2021)
Council
Neath Port Talbot
County
West Glamorgan
Region
Wales
Area
6.1 sq mi (15.7 km²)
ONS code
W45000537

Port Talbot’s neighbours

The nearest built-up areas, from ONS’s 2022 boundaries. See them on the map →

All towns in West Glamorgan →
CwmavonBaglanNeathCoedhirwaunTonnaMaestegPyleCwmavonBaglanNeathCoedhirwaunTonnaMaestegPylePort Talbot
How the neighbours grade
TownPeopleMilesOverallCostSafetyHealth
Port Talbot31,557—DB+DD−
Cwmavon4,5242.2C−B+C+D
Baglan10,5162.4C−B+CD
Neath40,7384.9DBC−D
Coedhirwaun1,2705.2—DA+C+
Tonna2,6655.6CB−BC−
Maesteg18,3425.9DA−C−D−
Pyle14,0756.3DB+C−D

Coedhirwaun has fewer than 2,500 residents, so it gets subject grades but no overall grade. People: Census 2021. Miles: centre to centre.

Questions about Port Talbot

How many listed buildings are there in Port Talbot?

32 on Cadw’s list, 4 of them Grade II*.

Is Port Talbot expensive to live in?

Homes cost less than in most UK towns: the median sale over three years was £153,000, against £277,000 in the typical UK town. By type: flats £146,750, terraced houses £129,000, semi-detached houses £166,000 and detached houses £274,995.

Does Port Talbot flood?

Surface water isn’t included. Check a specific address on Natural Resources Wales’s flood risk service.

Sources: ONS Census 2021, output areas summed to the ONS 2022 built-up area · HM Land Registry Price Paid (standard sales, September 2023 to August 2026) · ONS Price Index of Private Rents (August 2026, by council) · MHCLG and Welsh Government council tax, Band D 2026–27 (with parish precepts in England) · data.police.uk street-level crime, 36 months to August 2026, points inside the built-up-area boundary · ONS small-area life expectancy and healthy life expectancy, 2019 to 2023 (England and Wales), OHID Fingertips small-area indicators (England) and Census 2021 health, adjusted for age · ONS small-area income estimates (financial year ending 2023) · DWP claimant count via Nomis (January to August 2026) · Cadw listed buildings, scheduled monuments and registered historic parks and gardens via DataMapWales, October 2026, inside the ONS 2022 built-up-area boundary · Valuation Office Agency, Council Tax: stock of properties by build period (31 March 2025) · TownRatings grades: our own summary of the data, ranked against UK towns only. All under the Open Government Licence v3.0.

Contains public sector information licensed under the Open Government Licence v3.0. Contains HM Land Registry data © Crown copyright and database right 2026. Contains OS data © Crown copyright and database right 2026 (ONS boundaries). Northern Ireland: Source: NISRA; contains Land & Property Services data and Ordnance Survey of Northern Ireland information, © Crown copyright, licensed under the Open Government Licence v3.0. Scotland: contains National Records of Scotland data, Registers of Scotland data and SEPA data, © Crown copyright / © SEPA 2025, licensed under the Open Government Licence v3.0.