Halton’s biggest
Lune Riverside Park
Park or garden · 240 m outside town
16 ha (39 acres)1.8 km of path
25 minto walk all 1.8 km of path
22 pitchesfootball pitches would fit
0.8 mi south-westfrom the centre
Directionsto the nearest entrance
Each edition grades its towns against each other only.
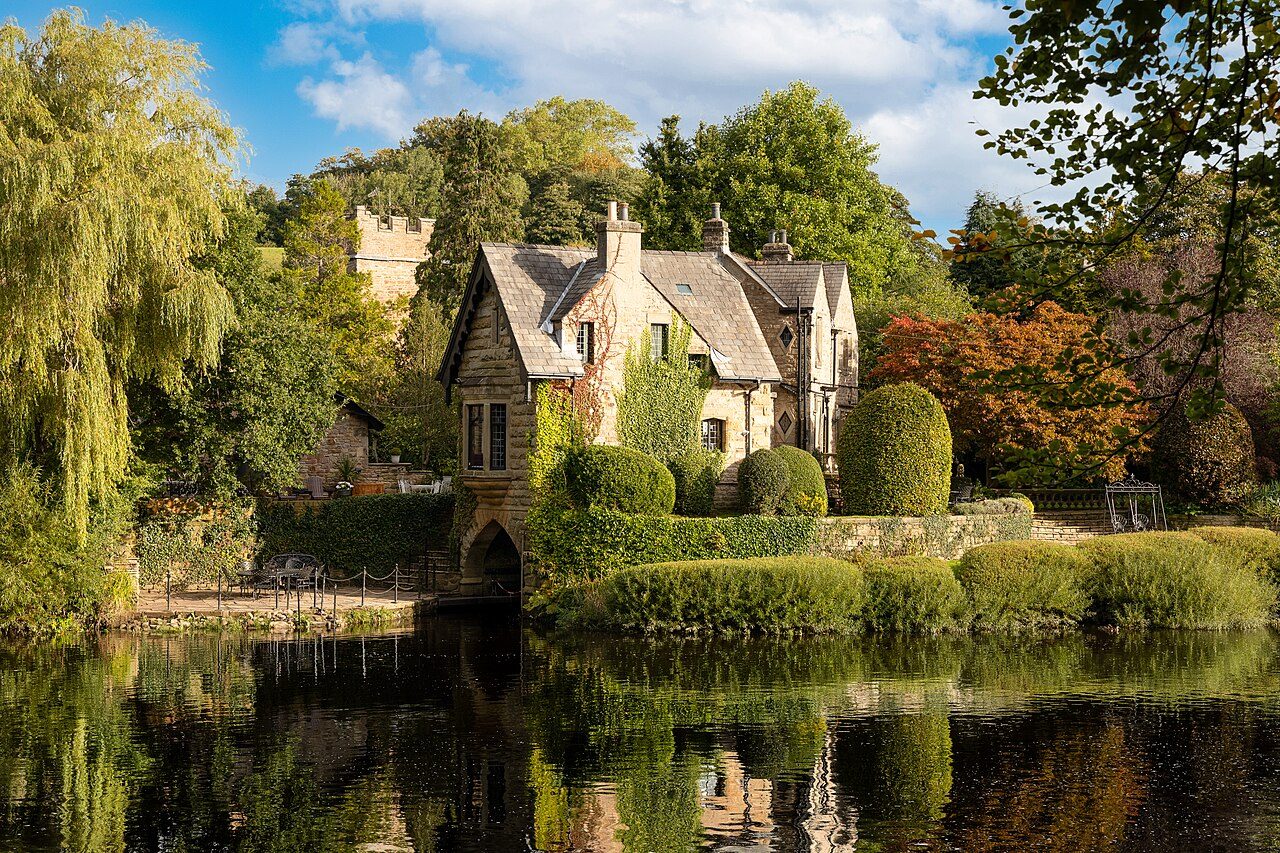 The Boat House · Photo: BarriePrice100 · CC BY-SA 4.0
The Forest Of Bowland National Landscape begins 0.1 mi from the town’s edge. Parks and playing fields in Halton add up to 0.9 ha for every 1,000 residents; the typical UK town has 2.1. Footpaths add up to 14 km in the town and the kilometre around it, 1.7 for every square kilometre. Halton grades B− for the outdoors: #43 of 65 in Lancashire. A character grade: it isn’t part of the overall grade.
Read from the data: what stands out first, good and bad.
Halton’s strongest suit is parks close to every home, followed by protected countryside on the doorstep. Where it falls short is park space per person.
Each chart is every UK town of 1,000 or more on one measure: the green bar is Halton, the dashed line the typical town. The number is the share of towns it beats; the five are averaged and the average ranked again.
Graded, never part of the overall grade (like History and Civic life). It measures what is mapped: OS Open Greenspace leaves out woodland and open-access land that isn’t a park, and OpenStreetMap’s rural paths are more complete in some places than others.
The 60 UK towns and cities of 2,500 to 2,800 people with an Outdoors Grade. Hover a dot for its figures; tap one for its page.
Against towns its size, Halton stands out most for homes near a park: none of the other 59 has more. It falls furthest behind on park space per resident, where 53 of the others do better.
| Town | Outdoors | Green space | Near a park | Path per km² | Protected | |
|---|---|---|---|---|---|---|
| 1 | Petworth West Sussex | A+ | 29.6 | 100% | 4.1 | 93% |
| 2 | Ambleside Cumbria | A+ | 6.9 | 92% | 4.6 | 100% |
| 3 | Tywardreath Cornwall | A+ | 4.6 | 100% | 2.5 | 26% |
| 4 | Settle North Yorkshire | A+ | 6.4 | 100% | 3.6 | 73% |
| 5 | Downley Buckinghamshire | A+ | 9.5 | 76% | 7.6 | 71% |
| 6 | Hadston Northumberland | A+ | 5.8 | 100% | 2 | 1% |
| 7 | Yorkley and Whitecroft Gloucestershire | A | 3.3 | 74% | 6.4 | 1% |
| 8 | Hellingly East Sussex | A | 6.9 | 90% | 3.7 | 11% |
| 9 | Dolgellau Gwynedd | A | 3.6 | 100% | 1.9 | 100% |
| 10 | Darenth Kent | A− | 1.8 | 100% | 4.3 | 1% |
| 11 | Newington Kent | A− | 2.3 | 78% | 2.3 | 21% |
| 12 | Combe Martin Devon | A− | 1.8 | 88% | 1.5 | 37% |
| 13 | Newhey Greater Manchester | B+ | 2.4 | 100% | 3.9 | 0% |
| 14 | Avonmouth Bristol | B+ | 2.5 | 100% | 1.8 | 0% |
| 15 | Langold Nottinghamshire | B+ | 13 | 100% | 2.3 | 0% |
| 16 | Blofield Norfolk | B+ | 2.9 | 100% | 1.5 | 17% |
| 17 | Dipton County Durham | B | 3.2 | 87% | 3.5 | 0% |
| 18 | Farington Moss Lancashire | B | 5.9 | 93% | 2.4 | 0% |
| 19 | Prestbury Cheshire | B | 5.6 | 42% | 3.2 | 6% |
| 20 | Builth Wells Powys | B | 4.9 | 100% | 1.6 | 0% |
| 21 | Brynamman Dyfed | B | 1.7 | 100% | 1 | 51% |
| 22 | Mancetter and Witherley Warwickshire | B− | 3.1 | 88% | 2.7 | 0% |
| 23 | Cliffe Woods Kent | B− | 1.7 | 62% | 2.5 | 1% |
| 24 | Halton Lancashire | B− | 0.9 | 100% | 1.7 | 35% |
| 25 | Grimsargh Lancashire | B− | 2.6 | 67% | 2.8 | 2% |
| 26 | Pucklechurch Gloucestershire | C+ | 1.2 | 64% | 4.2 | 20% |
| 27 | Godstone Surrey | C+ | 1.7 | 52% | 3.7 | 18% |
| 28 | Shevington Moor Greater Manchester | C+ | 2.1 | 90% | 2.8 | 0% |
| 29 | Ashington West Sussex | C+ | 1.3 | 86% | 2.3 | 21% |
| 30 | Hurworth-on-Tees County Durham | C+ | 4.5 | 93% | 1.2 | 0% |
| 31 | Snettisham Norfolk | C+ | 1.1 | 73% | 1.3 | 32% |
| 32 | Endon Staffordshire | C+ | 3 | 89% | 1.9 | 0% |
| 33 | Little Dunmow Essex | C+ | 1.1 | 89% | 3.8 | 0% |
| 34 | Dunchurch Warwickshire | C+ | 7.8 | 68% | 2.2 | 0% |
| 35 | Bosham West Sussex | C+ | 1.2 | 48% | 1.4 | 58% |
| 36 | Catterick North Yorkshire | C | 3.6 | 89% | 0.7 | 0% |
| 37 | Watlington Norfolk | C | 2.3 | 100% | 0.6 | 0% |
| 38 | South Brent Devon | C | 1.5 | 79% | 0.8 | 64% |
| 39 | Smallfield Surrey | C | 1.6 | 70% | 2.4 | 1% |
| 40 | Marham Norfolk | C | 3.5 | 85% | 0.4 | 0% |
| 41 | Shelley West Yorkshire | C− | 1.2 | 81% | 3.2 | 0% |
| 42 | Wittering Cambridgeshire | C− | 3.1 | 83% | 0.6 | 0% |
| 43 | South Wonston Hampshire | C− | 1.6 | 42% | 2.6 | 7% |
| 44 | Wolston Warwickshire | C− | 1.6 | 89% | 1.9 | 0% |
| 45 | Higham Kent | C− | 0.5 | 0% | 1.8 | 18% |
| 46 | Codicote Hertfordshire | C− | 0.4 | 90% | 2.6 | 0% |
| 47 | Newick East Sussex | C− | 1.7 | 35% | 2.1 | 16% |
| 48 | Hardwick Cambridgeshire | C− | 1.5 | 82% | 2.3 | 0% |
| 49 | Costessey Norfolk | C− | 1.8 | 12% | 3.5 | 0% |
| 50 | West Clyst Devon | C− | 0.6 | 59% | 4.2 | 0% |
| 51 | Saughall Cheshire | D | 2.5 | 27% | 2.3 | 0% |
| 52 | Christleton and Waverton Cheshire | D | 2.4 | 55% | 1.9 | 0% |
| 53 | Tonna West Glamorgan | D | 2.1 | 36% | 2.3 | 0% |
| 54 | Willington Derbyshire | D | 1.8 | 67% | 2 | 0% |
| 55 | Brierley South Yorkshire | D | 0.7 | 82% | 2.1 | 0% |
| 56 | Keele Staffordshire | D | 1.1 | 0% | 3.6 | 0% |
| 57 | Watton at Stone Hertfordshire | D | 0.8 | 61% | 2.3 | 0% |
| 58 | St Martins Shropshire | D | 0.6 | 59% | 0.8 | 2% |
| 59 | Swineshead Lincolnshire | D− | 1.2 | 73% | 0.7 | 0% |
| 60 | Manea Cambridgeshire | D− | 1.3 | 63% | 1 | 0% |
Tap a number to zoom to a park. Tap a layer to hide it. The dashed line is Halton’s built-up area.
The biggest is Lune Riverside Park, 16 ha (39 acres). Directions go to the park’s nearest public entrance where Ordnance Survey maps one.
Each square is 1 in 100 residents: green lives within 400 m of a public park, garden or playing field (Census 2021 output areas against OS Open Greenspace).
Playing fields count, so a park within reach isn’t always one with paths or trees; 8 playgrounds are mapped in and around the town, about one for every 332 residents.
Protected landscapes within 30 km, by direction and distance from the edge of the built-up area; circle size shows each one’s area. National Landscapes were called Areas of Outstanding Natural Beauty until 2023.
35% of the land within 5 km of Halton is National Park or National Landscape, more than 86% of UK towns. Lake District National Park covers 2,362 km² and has been a National Park since 1951.
14 km of footpaths, bridleways and rights of way are mapped in Halton and the kilometre around it, 1.7 km for every square kilometre (the typical UK town has 3.0). Bars show each route’s kilometres within 2 km of the town.
The regional route here is the Lune Valley Ramble.
Waymarked walks are OpenStreetMap walking routes. Public rights of way are only as complete as the map in each area.
The town’s 1991–2020 averages (Met Office HadUK-Grid) and the daylight at its latitude. Outlined months have 12½+ hours of daylight, highs of 15 °C or more and little rain for the town.
| Jan | Feb | Mar | Apr | May | Jun | Jul | Aug | Sep | Oct | Nov | Dec | |
|---|---|---|---|---|---|---|---|---|---|---|---|---|
| Daylight (h) | 7.9 | 9.7 | 11.7 | 14.0 | 16.0 | 17.1 | 16.6 | 14.8 | 12.6 | 10.4 | 8.4 | 7.4 |
| High (°C) | 7 | 7 | 9 | 12 | 15 | 18 | 19 | 19 | 17 | 13 | 9 | 7 |
| Rain (mm) | 109 | 114 | 76 | 68 | 56 | 71 | 92 | 112 | 109 | 124 | 118 | 134 |
May is the driest month (56 mm) and July the warmest (highs of 19 °C). Winter days are short, about 7 hours of daylight in December, and 134 mm of rain falls in December, the wettest month. Frost comes on about 36 nights a year. The climate in Halton →
Mapped within 2 km of the town in OpenStreetMap, against the typical UK town its size per resident. Named places are listed with directions; unnamed ones are only counted.
Halton is inland. These are the nearest named beaches, measured from the edge of the town.
Check the water before you swim. The Environment Agency tests designated bathing waters from May to September and publishes a rating for each beach.
Up high. Halton Hill, at 107 m, is the highest named top within 2 km of Halton.
Plus 2 slipways without a name on the map.
The nearest towns of 1,000+ within 12 miles. Tap a town for its outdoors page.
| Town | Outdoors | Green space, ha per 1,000 | Near a park | Protected within 5 km |
|---|---|---|---|---|
| Halton | B− | 0.9 | 100% | 35% |
| Caton 1.8 mi | C+ | 1.2 | 72% | 67% |
| Bolton-le-Sands 2.0 mi | C+ | 1.1 | 58% | 23% |
| Lancaster 2.7 mi | A+ | 2.4 | 96% | 22% |
| Carnforth 3.3 mi | A− | 1.2 | 89% | 39% |
| Morecambe 4.0 mi | B− | 0.8 | 84% | 2% |
| Warton (Lancaster) 4.7 mi | B− | 0.3 | 32% | 43% |
Lancaster, 2.7 miles away, grades A+, the best next door: 96% of its residents live within 400 m of a park. Lancaster has at least twice Halton’s green space per resident.
Lune Riverside Park, 16 ha (39 acres), with 1.8 km of path, just outside the built-up area. 1 named park, garden or playing field is in the town or within 400 m of it.
Yes. Lake District National Park begins 8.7 mi north-west of the town’s edge. It covers 2,362 km² and has been a National Park since 1951. The nearest protected landscape of any kind is the Forest Of Bowland National Landscape, 0.1 mi away.
1 waymarked walking route passes within 2 km of the town, including the Lune Valley Ramble.
Mallows Bay, 3.9 mi from the edge of the town, then Half Moon Bay (5.9 mi). Halton itself is inland.
100% of residents live within 400 m, about a 5-minute walk, of a public park, garden or playing field (Census 2021 output areas against OS Open Greenspace). The typical UK town is 83%.
May to September: the longest days, the warmest afternoons and the least rain of the year, from the Met Office 1991–2020 averages.
Paths are thinner than most towns: 1.7 km of footpath and right of way per square kilometre, more than 22% of UK towns. For park space per person it beats 11% (0.9 ha per 1,000 residents).
From five measures, each placed among UK towns of 1,000 or more: public green space per resident, the share living near a park, National Park or National Landscape within 5 km, footpaths per square kilometre, and the sea within 5 km. It is a character grade and isn’t part of Halton’s overall grade.
Contains public sector information licensed under the Open Government Licence v3.0. Contains HM Land Registry data © Crown copyright and database right 2026. Contains OS data © Crown copyright and database right 2026 (ONS boundaries). Northern Ireland: Source: NISRA; contains Land & Property Services data and Ordnance Survey of Northern Ireland information, © Crown copyright, licensed under the Open Government Licence v3.0. Scotland: contains National Records of Scotland data, Registers of Scotland data and SEPA data, © Crown copyright / © SEPA 2025, licensed under the Open Government Licence v3.0.