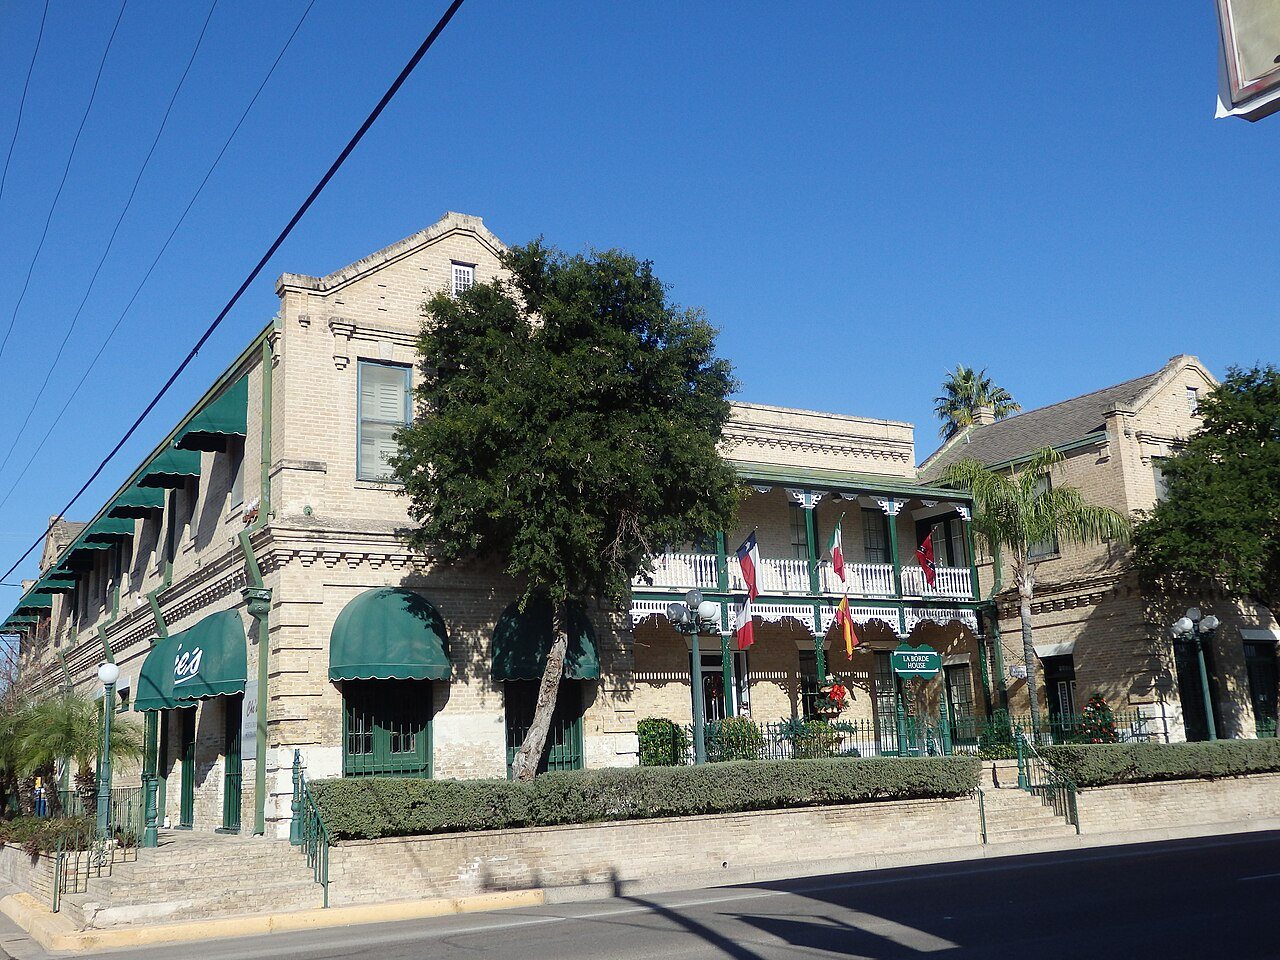
 Rio Grande City Downtown Historic District · Photo: David Bezanson · CC BY-SA 4.0
Rio Grande City records more property crime per head than 73% of U.S. towns
In sum, crimes its police reported from 2023 to 2025 put Rio Grande City at C+ (#259 of 471 graded towns in Texas): more crime per resident than 63% of U.S. towns. Per 1,000 residents a year, 1.6 violent crimes and 18.0 incidents of property crime were recorded, against 4.3 and 23.6 in the rest of Texas.
Crimes reported to the FBI per 1,000 residents a year, 2023–2025. “Rest of TX” is every other Texas city and town in the FBI’s tables; the U.S. figure is the FBI’s national estimate as published, averaged over the three years. The FBI publishes no national homicide or robbery rate in our data, so those compare with all U.S. cities and towns in its tables.
What’s behind Rio Grande City’s grade
Property crimes plus four times violent crimes reported to the FBI per resident, 2023–2025, on a national curve. Violent crime holds Rio Grande City’s grade up; property crime pulls it down.
Violent crime, by year and by type
Show as a table
| Year | Rio Grande City | Rest of Texas | U.S. (FBI national estimate) |
|---|---|---|---|
| 2022 | 1.5 | 5.1 | 4.0 |
| 2023 | 1.4 | 4.7 | 3.9 |
| 2024 | 1.9 | 4.4 | 3.6 |
| 2025 | 1.7 | 3.8 | 3.3 |
Violent crimes per 1,000 residents
By type 2023–2025, counts
Rio Grande City’s police reported 76 violent crimes to the FBI over 2023–2025, about 1.6 per 1,000 residents a year, against 4.3 in the rest of Texas and the FBI’s national estimate of 3.6.
Crime in Rio Grande City per 1,000 residents
Violent crime per 1,000 residents, 2025
Property crime per 1,000 residents, 2025
Crimes reported to police in 2025 per resident; one person can be the victim of more than one, and some reports involve visitors.
And about 2 violent crimes, in 2025. Below are 1,000 dots, one per resident; each colored dot is one reported crime.
Reported crime is steady
Show as a table
| Year | Rio Grande City property | Rest of Texas property | Rio Grande City violent | Rest of Texas violent |
|---|---|---|---|---|
| 2022 | 17.3 | 27.3 | 1.5 | 5.1 |
| 2023 | 20.0 | 26.3 | 1.4 | 4.7 |
| 2024 | 17.4 | 23.9 | 1.9 | 4.4 |
| 2025 | 16.6 | 20.6 | 1.7 | 3.8 |
Crimes per 1,000 residents
Reported crime per resident was steady from 2023 to 2025: the change is within ordinary year-to-year swings. Per 1,000 residents, 2022–2025, against the rest of Texas.
284 crimes reported in 2025
2025 offenses reported
Offenses reported to police, not convictions. FBI Uniform Crime Reporting. The last row is counted outside the property total.
26 violent and 258 property, as reported to the FBI by Rio Grande City’s police.
Four people died in crashes on Rio Grande City’s roads in 2019–2023
Rio Grande City had 4 fatal crashes in five years, in which four people died; 1 was a pedestrian and 1 was a cyclist.
That is about what is typical for Texas towns of 5,000–25,000 people: at their median rate (7.3 deaths per 100,000 residents a year), a town of Rio Grande City’s size would see about 6 in five years. With numbers this small, a death or two either way changes the picture, so Rio Grande City’s own rate (5.2) is context, not a ranking.
Deaths are counted where the crash happened, not where the people lived: a highway through town adds through-traffic deaths, and residents’ own risk on roads elsewhere isn’t here. Town rates sit below state and U.S. rates because a third of fatal crashes happen outside any town. Road safety is described here and is not part of the Safety Grade. Source: NHTSA Fatality Analysis Reporting System (FARS), 2019–2023.
Rio Grande City and its neighbors
| Town | Grade | Violent | Property |
|---|---|---|---|
| Rio Grande City | C+ | 1.6 | 18.0 |
| Las Lomas | — | — | — |
Crimes reported to the FBI per 1,000 residents a year, 2023–2025. Las Lomas is an unincorporated community (a census-designated place) with no police department of its own.
Texas towns of a similar size
| Town | Grade | Violent | Property |
|---|---|---|---|
| Rio Grande City | C+ | 1.6 | 18.0 |
| West University Place | B+ | 0.6 | 10.6 |
| Hidalgo | B− | 1.5 | 13.4 |
| Azle | C+ | 2.5 | 15.6 |
| Uvalde | C− | 3.7 | 18.6 |
| Tomball | C− | 3.3 | 20.9 |
The five graded Texas towns closest to Rio Grande City’s population (15,451), by grade.
How reported crime compares across the town line. Tap a town to see its safety page.
What this data can and can’t tell you
- It’s reported crime. Only incidents reported to and recorded by police appear here. Many crimes are never reported to police.
- One number for all of Rio Grande City. A town-wide rate doesn’t show where incidents happen, and that can differ a lot from one part of town to another.
- Visitors count too. Incidents involving people who work, shop or visit are counted against Rio Grande City’s residents, which raises the per-resident rate.
- Whose population. Rates use the FBI’s population for the department (15,573 in 2025); our figure for Rio Grande City is 15,451 (2025 Census estimate).
- Gaps are real gaps. A missing year means the department didn’t report a full year, not that nothing happened.
How the grade is calculated, for every town: How TownRatings grades safety →
Questions about safety in Rio Grande City
Is Rio Grande City, TX safe?
On crimes reported to the FBI in 2023–2025, Rio Grande City reports more crime per resident than 63% of U.S. towns, a C+ Safety Grade and #259 of 471 in Texas. Its police reported 1.6 violent crimes per 1,000 residents a year, against 4.3 in the rest of Texas and the FBI’s national estimate of 3.6.
What is the crime rate in Rio Grande City?
1.6 violent and 18.0 property crimes per 1,000 residents a year, 2023–2025, as reported to the FBI. The rest of Texas reports 4.3 and 23.6; the FBI’s national estimate is 3.6 and 17.6.
Who polices Rio Grande City?
Rio Grande City’s own police department, which reports to the FBI as “Rio Grande City”. Its figures are the ones on this page.
Heads-up board
Your answer becomes a post in Town Square.
Please don’t name or describe individuals. In an emergency, call 911.
Neighbors looking out for each other in Rio Grande City.
Crime: FBI Uniform Crime Reporting Program, Crime Data Explorer: offenses known to law enforcement by city, 2025, and state and national rates. Counts are crimes reported to police, not convictions. The Safety Grade is our own summary of that data, not an official rating. Road deaths: NHTSA Fatality Analysis Reporting System (FARS), 2019–2023. This isn’t an official statement of public safety. In an emergency, call 911.