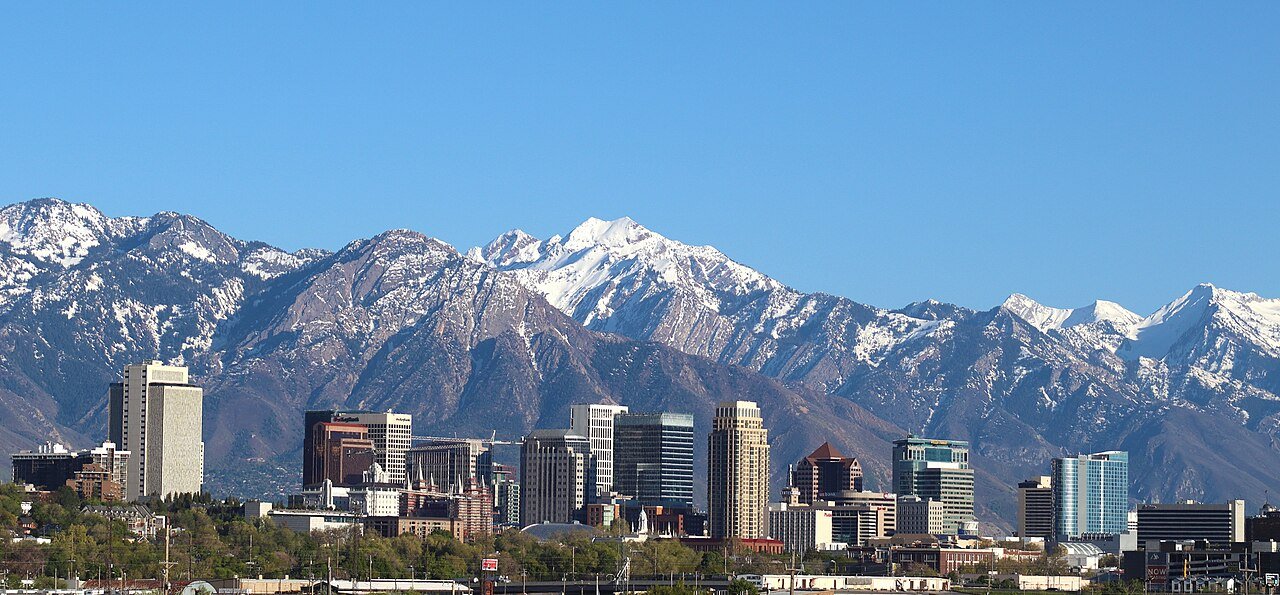
 Utah, #1 overall · Salt Lake City, the state capital · Photo: Invictus323 · CC BY 4.0
How the states stack up
Utah earns the top overall score of the 50 states and D.C., followed by Indiana and Minnesota. Subject by subject the leaders change: New Jersey has the strongest schools, New Hampshire has the least crime and West Virginia has the lowest costs. Every state’s card puts the official state figure beside how its towns compare with the rest of the country.
Eight subjects per state: safety, schools, cost of living, health, housing, natural hazards, commute and growth. How the scores work
Every state, ranked
Ranked by overall score, each with its own story. Pick a subject above to re-rank by it.
No state scores higher overall: Utah earns an A+, 100 of 100. Utah tops the country on growth from 2010 to 2020: the population grew 18.4%. Utah is safe and split at once: 21% of residents live in towns among the nation’s safest quarter, like Smithfield and Mapleton, while 16% live in places such as Salt Lake City, Ogden and Murray, in the quarter reporting the most crime.
SafetyA−SchoolsA−CostBHealthAHousingAHazardsC−CommuteB+GrowthAUtah report card →Crime in Indiana depends on the town: Lowell and St. John rank among the safest places in the country, while 47% of residents live in towns like Indianapolis, Evansville and South Bend at the other end. It is home to the country’s top-ranked town for cost of living: Wabash. Overall it ranks 2nd of 51, an A+.
SafetyB+SchoolsACostAHealthCHousingAHazardsB+CommuteBGrowthB−Indiana report card →Minnesota’s strongest suits are widespread home ownership and healthy residents (only 16% of adults in fair or poor health). Overall it ranks 3rd of 51, an A+. There is no weak subject here: its lowest grade is a B−.
SafetyA−SchoolsB+CostB−HealthA−HousingAHazardsBCommuteB+GrowthBMinnesota report card →In Wisconsin, none of its neighbors matches it on schools and natural-hazard risk. That leaves it 4th of 51, with an A (94 of 100). It stands out for schools that rank 8th on the Nation’s Report Card and short commutes (22 minutes on average).
SafetyB+SchoolsA+CostB−HealthBHousingB−HazardsACommuteA−GrowthC+Wisconsin report card →Iowa is steady across the board, with nothing below a B−. Across its larger towns, 94% of residents live in one of the nation’s shortest-commute towns. Overall it ranks 5th of 51, an A.
SafetyB+SchoolsBCostB+HealthBHousingB−HazardsB+CommuteAGrowthB−Iowa report card →Only one state grew faster between 2010 and 2020 than Idaho: the population grew 17.3%. Idaho spends less per pupil than most states (51st) and still scores 13th on the Nation’s Report Card. That balance adds up to an A overall and 6th place among the 50 states and D.C.
SafetyASchoolsC−CostB−HealthA−HousingB+HazardsB+CommuteA−GrowthA+Idaho report card →Few states have towns as safe as North Union Township and Penn Township, and few of those also have cities like Philadelphia, Pittsburgh and Upper Darby Township, where reported crime ranks in the top quarter nationally; Pennsylvania has both. Look town by town and Pennsylvania has a national leader: Greensburg for natural-hazard risk. Pennsylvania ranks 7th overall, with an A and a score of 88.
SafetyASchoolsACostBHealthBHousingAHazardsA−CommuteCGrowthDPennsylvania report card →Ohio’s standout town is St. Marys Township, #5 in the country for cost of living. The overall grade: A, a score of 86 that ranks 8th. Its strength is strong schools; its weak spot, slow growth (+2.3% from 2010 to 2020).
SafetyB+SchoolsA−CostBHealthC+HousingBHazardsACommuteBGrowthCOhio report card →Only one state charges homeowners more in property tax: in New Hampshire, the typical property-tax bill is $6,667. On home ownership, New Hampshire is a state of two halves: 25% of residents live in top-quarter towns such as Windham and Amherst, and 47% in bottom-quarter ones such as Manchester and Nashua. Its overall score of 84 ranks 9th, an A−.
SafetyA+SchoolsACostC−HealthAHousingA+HazardsCCommuteC−GrowthC−New Hampshire report card →Kentucky beats every neighbor (Indiana, Ohio, West Virginia, Virginia and Tennessee) on safety and commuting. The good news is low crime (violent crime 35% below the national figure) and strong schools; the bad news, poor health (22% of adults in fair or poor health). Across all eight subjects, Kentucky lands 10th (A−).
SafetyA−SchoolsA−CostAHealthDHousingCHazardsC+CommuteB+GrowthCKentucky report card →On natural-hazard risk, North Dakota is a state of two halves: 22% of residents live in top-quarter towns such as Minot and Williston, and 22% in bottom-quarter ones such as Bismarck and Mandan. Only one state has shorter commutes: in North Dakota, the average trip to work takes 17.9 minutes. On balance it grades A−, which places it 11th.
SafetyC+SchoolsC−CostB+HealthAHousingD−HazardsB+CommuteA+GrowthA+North Dakota report card →In Virginia, town by town, 72% of residents live in one of the country’s lowest-risk towns (the top quarter), with almost none at the other end. Its overall score of 78 ranks 12th, an A−. It offers schools that rank 21st on the Nation’s Report Card and healthy residents (only 18% of adults in fair or poor health), but at the cost of 27.3-minute commutes.
SafetyBSchoolsA−CostC+HealthB+HousingB−HazardsACommuteC−GrowthB−Virginia report card →No state charges homeowners more in property tax than New Jersey: the typical property-tax bill is $9,590. New Jersey is safe and split at once: 35% of residents live in towns among the nation’s safest quarter, like Vernon Township and Bernards Township, while 20% live in places such as Newark, Paterson and Elizabeth, in the quarter reporting the most crime. All told, New Jersey grades A−, 13th of 51 with a score of 76.
SafetyASchoolsA+CostDHealthA−HousingBHazardsBCommuteD−GrowthC+New Jersey report card →Only two states have shorter commutes than Wyoming: the average trip to work takes 18.8 minutes. Its weak spot is slow growth (+2.3% from 2010 to 2020). Weighed together, that earns a B+ (74 of 100), 14th among the states.
SafetyBSchoolsC+CostAHealthCHousingC+HazardsBCommuteAGrowthDWyoming report card →In Alabama, On the plus side, high home ownership (70% of homes owner-occupied) and strong schools; on the minus side, costly natural hazards and health that trails most states. The sum of it: a B+ and a score of 72, 15th of 51. Alabama tops the country on cost of living: the typical property-tax bill is $788.
SafetyC+SchoolsB+CostA+HealthC−HousingA−HazardsC−CommuteBGrowthBAlabama report card →Massachusetts tops the country on schools: 42% of its 4th and 8th graders score Proficient or better. All told, Massachusetts grades B+, 16th of 51 with a score of 70.
SafetyB+SchoolsA+CostDHealthAHousingB−HazardsACommuteDGrowthC+Massachusetts report card →Crime in Connecticut depends on the town: Weston and Plainfield rank among the safest places in the country, while 17% of residents live in towns like New Haven, Hartford and Waterbury at the other end. Only two states charge homeowners more in property tax: in Connecticut, the typical property-tax bill is $6,643. Connecticut ranks 17th overall, with a B+ and a score of 68.
SafetyASchoolsACostDHealthAHousingA−HazardsCCommuteC−GrowthD−Connecticut report card →No state reports less violent crime per resident than Maine: 95.0 violent crimes per 100,000 residents in 2025. Standish and Wells rank near the top of the country for home ownership; Portland and Lewiston sit near the bottom. Put together, the eight subjects come to a B+, 18th in the country.
SafetyA+SchoolsC−CostCHealthC+HousingA+HazardsA−CommuteB+GrowthCMaine report card →In Michigan, the trade-off is clear: relatively little exposure to natural disasters on one side, slow growth (+2.0% from 2010 to 2020) on the other. That balance adds up to a B overall and 19th place among the 50 states and D.C. Only two states have a higher share of homes lived in by their owners: in Michigan, 73% of homes are owner-occupied.
SafetyB−SchoolsB−CostBHealthB−HousingA+HazardsACommuteB−GrowthDMichigan report card →Few states have towns as safe as Campton Hills and Pingree Grove, and few of those also have cities like Chicago, Rockford and Springfield, where reported crime ranks in the top quarter nationally; Illinois has both. Illinois ranks 20th overall, with a B and a score of 62. Its strengths are schools that rank 16th on the Nation’s Report Card and widespread home ownership; its weak spots, long commutes and $5,298 property-tax bills (70% above the national figure).
SafetyA−SchoolsA−CostCHealthB+HousingB+HazardsBCommuteDGrowthD−Illinois report card →In Missouri, across its larger towns, 54% of residents live in one of the nation’s most affordable towns. On the plus side, widespread home ownership; on the minus side, health that trails most states and slow growth (+2.8% from 2010 to 2020). On balance it grades B, which places it 21st.
SafetyC+SchoolsBCostAHealthC−HousingB+HazardsC+CommuteBGrowthCMissouri report card →In South Carolina, next to North Carolina and Georgia, it has the best cost of living and home ownership and the weakest safety and schools. The good news is fast growth (+11% from 2010 to 2020) and the 6th lowest property-tax bills in the country; the bad news, test scores 20th lowest on the Nation’s Report Card. The sum of it: a B and a score of 58, 22nd of 51.
SafetyC+SchoolsCCostA−HealthC+HousingA−HazardsCCommuteC+GrowthASouth Carolina report card →Alongside low costs and a growing population, South Dakota has above-average crime and low home ownership. Across all eight subjects, South Dakota lands 23rd (B). South Dakota tops the country on commuting: the average trip to work takes 17.8 minutes.
SafetyC−SchoolsC+CostA−HealthB−HousingCHazardsC+CommuteA+GrowthA−South Dakota report card →Colorado’s schools stretch a dollar: 27th in spending per pupil, yet 5th on the Nation’s Report Card. On balance it grades B−, which places it 24th. It offers healthy residents (only 16% of adults in fair or poor health) and a growing population, but at the cost of above-average crime and high costs.
SafetyCSchoolsB−CostCHealthA+HousingC+HazardsB−CommuteC+GrowthA+Colorado report card →Only three states report less violent crime per resident: in Rhode Island, 145.8 violent crimes per 100,000 residents in 2025. Among its neighbors it leads on safety and commuting and trails on schools and cost of living. The overall grade: B−, a score of 52 that ranks 25th.
SafetyA+SchoolsBCostD−HealthB+HousingC+HazardsA−CommuteC−GrowthC−Rhode Island report card →In Tennessee, Nolensville and Spring Hill rank near the top of the country for growth; Memphis and Dyersburg sit near the bottom. Its strength is the 7th lowest property-tax bills in the country; its weak spots, poor health (22% of adults in fair or poor health) and more crime than most states (violent crime 51% above the national figure). That balance adds up to a B− overall and 26th place among the 50 states and D.C.
SafetyCSchoolsACostB+HealthC−HousingCHazardsB−CommuteB−GrowthA−Tennessee report card →In Mississippi, On the plus side, the 5th lowest property-tax bills in the country and low crime (violent crime 32% below the national figure); on the minus side, health that trails most states. Weighed together, that earns a B− (48 of 100), 27th among the states. Only one state grew more slowly between 2010 and 2020: in Mississippi, the population fell 0.2%.
SafetyA−SchoolsC+CostAHealthDHousingBHazardsDCommuteB−GrowthDMississippi report card →On health, Maryland is a state of two halves: 29% of residents live in top-quarter towns such as Bethesda and North Bethesda, and 23% in bottom-quarter ones such as Baltimore and Dundalk. The overall grade: B−, a score of 46 that ranks 28th.
SafetyC−SchoolsBCostC+HealthA−HousingA−HazardsA+CommuteD−GrowthBMaryland report card →Inland flooding accounts for 55% of the damage FEMA expects natural hazards to do to Nebraska’s buildings each year. Only two states put more of their people in the nation’s shortest-commute quarter of towns: 98% of Nebraska’s town residents live in one. Its overall score of 44 ranks 29th, a C+.
SafetyBSchoolsB−CostC+HealthB−HousingDHazardsDCommuteA+GrowthB+Nebraska report card →Look town by town and Washington has a national leader: Mercer Island for health (#3). It offers fast growth (+15% from 2010 to 2020) and healthy residents (only 16% of adults in fair or poor health), but at the cost of $4,556 property-tax bills (46% above the national figure) and low home ownership. Across all eight subjects, Washington lands 30th (C+).
SafetyB−SchoolsB+CostDHealthA−HousingC−HazardsCCommuteCGrowthAWashington report card →Kansas struggles most with more crime than most states (violent crime 44% above the national figure) and low home ownership. Put together, the eight subjects come to a C+, 31st in the country. Leawood and Prairie Village rank near the top of the country for health; Wichita and Kansas City sit near the bottom.
SafetyDSchoolsC+CostB+HealthB+HousingCHazardsC+CommuteAGrowthCKansas report card →In Georgia, across its larger towns, 41% of residents live in one of the nation’s lowest-risk towns. Its overall score of 38 ranks 32nd, a C+. Its strength is fast growth (+11% from 2010 to 2020); its weak spots, a renters’ market (66% of homes owner-occupied) and long commutes.
SafetyBSchoolsC+CostB−HealthC+HousingC−HazardsA−CommuteC−GrowthB+Georgia report card →North Carolina’s schools stretch a dollar: 43rd in spending per pupil, yet 19th on the Nation’s Report Card. Its standout town is Morrisville, #9 in the country for health. All told, North Carolina grades C+, 33rd of 51 with a score of 36.
SafetyC+SchoolsCCostBHealthBHousingC−HazardsC+CommuteC+GrowthA−North Carolina report card →Delaware spends more per pupil than most states (10th), but its students score 47th on the Nation’s Report Card. The good news is high home ownership (73% of homes owner-occupied) and the 13th lowest property-tax bills in the country; the bad news, above-average crime. Weighed together, that earns a C (34 of 100), 34th among the states.
SafetyC−SchoolsC−CostA−HealthC+HousingAHazardsB+CommuteC+GrowthBDelaware report card →No state has longer commutes than New York: the average trip to work takes 32.6 minutes. Massapequa Park and Garden City rank near the top of the country for home ownership; New York City and Buffalo sit near the bottom. The overall grade: C, a score of 32 that ranks 35th.
SafetyB−SchoolsB+CostC−HealthB+HousingC+HazardsA+CommuteDGrowthC−New York report card →Only one state has fewer adults in fair or poor health: in Vermont, 15% of adults say their health is fair or poor. All told, Vermont grades C, 36th of 51 with a score of 30. It offers low natural-hazard risk and easy commutes, but at the cost of $5,039 property-tax bills (62% above the national figure) and slow growth.
SafetyB−SchoolsDCostD−HealthA+HousingBHazardsA−CommuteA−GrowthDVermont report card →West Virginia ranks last in the country on health: 25% of adults say their health is fair or poor. West Virginia spends more per pupil than most states (29th), but its students score 49th on the Nation’s Report Card. West Virginia ranks 37th overall, with a C and a score of 28.
SafetyCSchoolsB−CostA+HealthD−HousingA−HazardsDCommuteB−GrowthD−West Virginia report card →Only two states grew faster between 2010 and 2020: in Texas, the population grew 15.9%. Its strength is strong schools; its weak spots, a renters’ market (63% of homes owner-occupied) and $4,232 property-tax bills (36% above the national figure). Put together, the eight subjects come to a C, 38th in the country.
SafetyB−SchoolsB+CostC−HealthCHousingDHazardsB−CommuteCGrowthA−Texas report card →In Arkansas, On the plus side, easy commutes; on the minus side, poor health (24% of adults in fair or poor health) and a renters’ market (66% of homes owner-occupied). That balance adds up to a C− overall and 39th place among the 50 states and D.C. Only two states charge homeowners less in property tax: in Arkansas, the typical property-tax bill is $1,040.
SafetyC−SchoolsB−CostA+HealthD−HousingC−HazardsDCommuteA−GrowthB−Arkansas report card →No state expects more yearly damage from natural hazards, by FEMA’s count: in Hawaii, $364 a year for every $100,000 of buildings. Hawaii ranks 40th overall, with a C− and a score of 22. The good news is the 8th lowest violent-crime rate in the country; the bad news, a renters’ market (63% of homes owner-occupied) and test scores below most states.
SafetyASchoolsC−CostC+HealthBHousingC−HazardsD−CommuteCGrowthC+Hawaii report card →Montana spends less per pupil than most states (41st) and still scores 14th on the Nation’s Report Card. Town by town, 97% of residents live in one of the country’s shortest-commute towns (the top quarter), with almost none at the other end. On balance it grades C−, which places it 41st.
SafetyDSchoolsCCostCHealthB−HousingCHazardsBCommuteAGrowthB+Montana report card →Inland flooding accounts for 85% of the damage FEMA expects natural hazards to do to Arizona’s buildings each year. Its weak spots are test scores below most states and above-average crime. The sum of it: a C− and a score of 18, 42nd of 51.
SafetyCSchoolsDCostB−HealthB−HousingBHazardsC−CommuteCGrowthB+Arizona report card →In Florida, the trade-off is clear: a growing population and widespread home ownership on one side, 28.0-minute commutes and poor health (20% of adults in fair or poor health) on the other. Across all eight subjects, Florida lands 43rd (C−). When nature does damage in Florida, it is mostly hurricanes: 54% of FEMA’s expected building losses.
SafetyBSchoolsCCostCHealthC−HousingB+HazardsD−CommuteDGrowthA−Florida report card →Only one state scores lower on the Nation’s Report Card than Oklahoma: 23% of its 4th and 8th graders score Proficient or better. On balance it grades D, which places it 44th. Its strengths are low costs (a typical property-tax bill of $1,599) and short commutes (22 minutes on average); its weak spots, low home ownership and health that trails most states.
SafetyC−SchoolsD−CostA−HealthDHousingDHazardsC−CommuteA−GrowthBOklahoma report card →No state scores lower on the Nation’s Report Card than New Mexico: 19% of its 4th and 8th graders score Proficient or better. It trails all of its neighbors on safety, health and growth. The overall grade: D, a score of 12 that ranks 45th.
SafetyD−SchoolsDCostB+HealthDHousingB+HazardsB−CommuteB+GrowthB−New Mexico report card →No state reports more violent crime per resident than Washington, D.C.: 806.0 violent crimes per 100,000 residents in 2025. Spending and results part ways in its schools: 2nd in spending per pupil, 44th on the Nation’s Report Card. That balance adds up to a D overall and 46th place among the 50 states and D.C.
SafetyD−SchoolsD−CostC−HealthA+HousingD−HazardsA+CommuteD−GrowthAWashington, D.C. report card →Only three states charge homeowners less in property tax than Louisiana: the typical property-tax bill is $1,180. Hurricanes account for 57% of the damage FEMA expects natural hazards to do to Louisiana’s buildings each year. Overall it ranks 47th of 51, a D.
SafetyDSchoolsCCostA−HealthD−HousingB−HazardsDCommuteB−GrowthC−Louisiana report card →Oregon comes in 48th of 51 with a D (6 of 100). Spending and results part ways in its schools: 19th in spending per pupil, 43rd on the Nation’s Report Card. Its weak spots are a renters’ market (63% of homes owner-occupied) and high costs.
SafetyCSchoolsDCostC−HealthCHousingDHazardsCCommuteBGrowthB+Oregon report card →Only two states score lower overall: Nevada grades D−, 4 of 100. California, Oregon, Idaho, Utah and Arizona all do better on safety, schools and health. It struggles most with a renters’ market (60% of homes owner-occupied) and test scores below most states.
SafetyDSchoolsDCostC+HealthDHousingDHazardsB−CommuteC+GrowthANevada report card →Only one state reports more violent crime per resident: in Alaska, 736.1 violent crimes per 100,000 residents in 2025. Spending and results part ways in its schools: 14th in spending per pupil, 48th on the Nation’s Report Card. Overall it ranks 50th of 51, a D−.
SafetyD−SchoolsD−CostDHealthC−HousingC+HazardsC−CommuteAGrowthC−Alaska report card →California struggles most with a renters’ market (56% of homes owner-occupied) and high costs. No state scores lower overall; California grades D−. Only one state expects more yearly damage from natural hazards, by FEMA’s count: in California, $306 a year for every $100,000 of buildings.
SafetyDSchoolsBCostD−HealthCHousingD−HazardsD−CommuteDGrowthC+California report card →
How the state scores work
Two measures per subject. The official figure a state agency or federal survey publishes (the FBI’s violent-crime rate, the Nation’s Report Card, FEMA’s expected building damage …), ranked against the other states, and a measure built from our town grades: how many of the state’s residents live in towns in the national top quarter.
Scores and grades. Each subject score (0–100) is the state’s standing among the 50 states and D.C.; the overall score weighs safety and cost of living 18, schools 16, health 14, commute 10, and housing, hazards and growth 8 each. Letters use the town-grade scale. Each state’s report card shows the figures and sources behind every grade. How grades work