
Baltimore and Ohio Railroad : Locomotive BO 2107, 1910
Folsom’s story
139 years in pictures
The archive holds 6 old photos and papers going back to 1910.
- 1887Folsom is settled
Each edition grades its towns against each other only.
With 8,671 residents, this town was settled in 1887.
Folsom’s typical household income is $113,000, against $81,000 in Pennsylvania’s towns and $80,000 across U.S. towns. We don’t grade Folsom yet; the figures below are still real.
Where Folsom’s working residents go each day. Line width shows the share.
Census LEHD 2023
The archive holds 6 old photos and papers going back to 1910.
Museums, parks, gardens and other places to visit around Folsom. Close and well known come first.
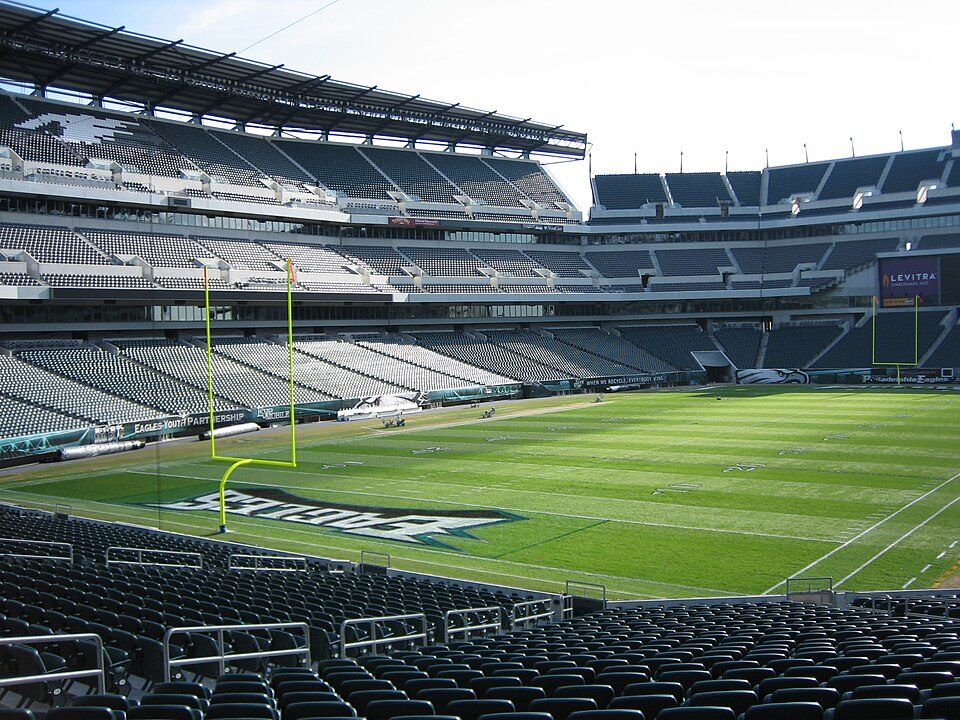 Big draw9 mi Stadium & arenaLincoln Financial Field
 Big draw11 mi MuseumUSS New Jersey
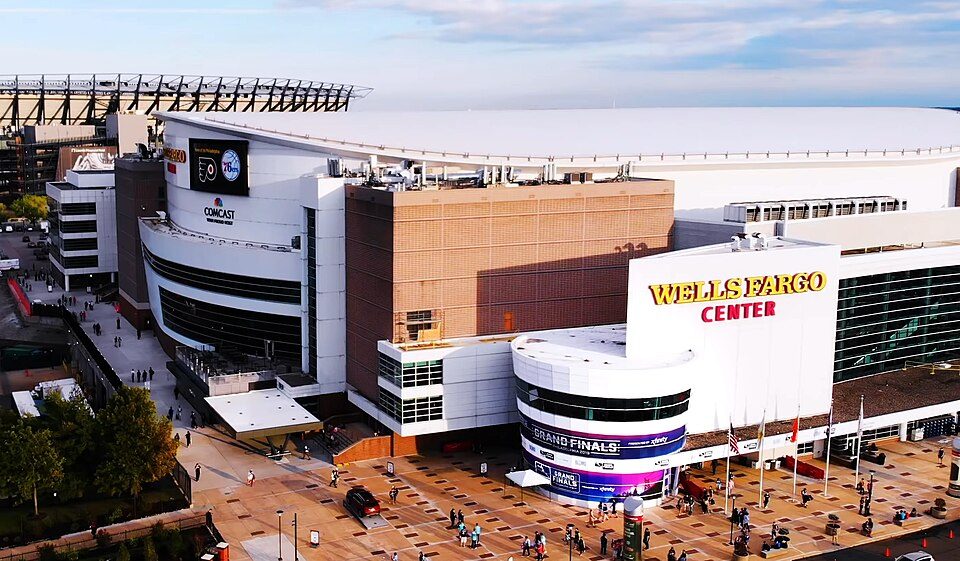 Big draw8 mi Stadium & arenaXfinity Mobile Arena
 Big draw10 mi Ancient siteIndependence Hall3.0M visitors a year
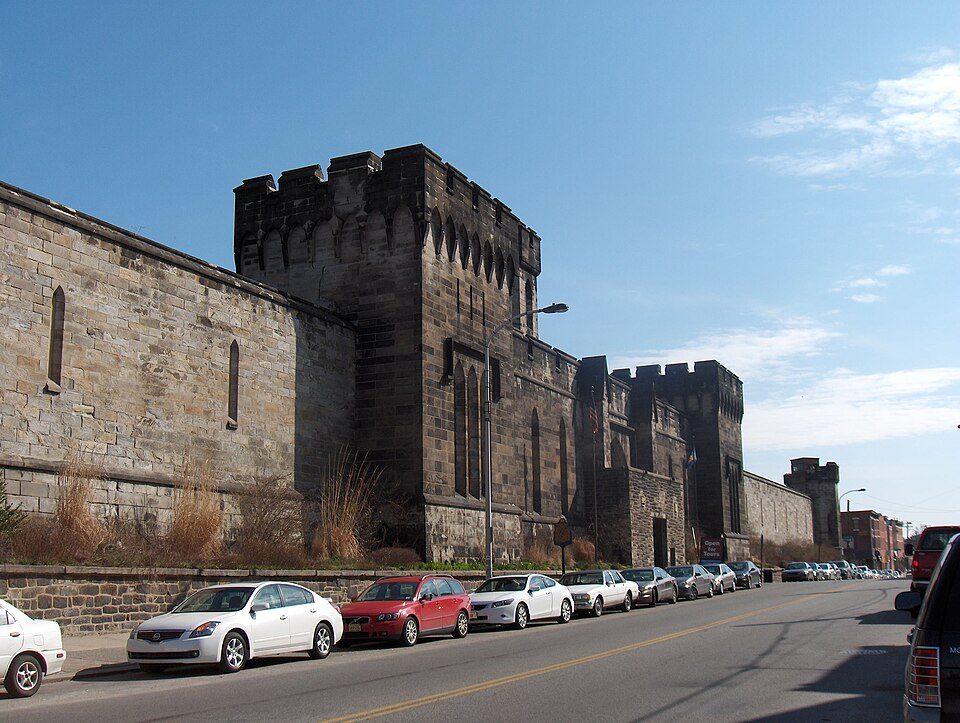 Big draw10 mi MuseumEastern State Penitentiary
 7 mi Park & preserveSchuylkill River
Lincoln Financial Field: The original uploader was Betp at French Wikipedia., CC BY-SA 3.0 · USS New Jersey: Camera Operator: PH3 BRYANT, Public domain · Xfinity Mobile Arena: Jen Smith, CC BY 3.0 · Independence Hall: Mys 721tx, CC BY-SA 3.0 · Eastern State Penitentiary: Davidt8, Public domain · Schuylkill River: Emy111 at English Wikipedia, Public domain
Folsom is unincorporated, so Delaware County and regional agencies provide most services.
EPA SDWIS (Oct 9, 2026) · HIFLD + EIA-861 2025 · Census 2020 ZCTAs · NCES 2024–25 · registration: vote.gov, updated Nov 18, 2024.
Ordered by what stands out in Folsom.
Folsom’s FEMA risk score stands at 20 of 100. The national flood insurance program has paid 42 claims locally since 1989. 54% of the town’s expected losses from natural hazards come from inland flooding, followed by heat waves at 11%.
FEMA flood insurance claims · FEMA National Risk Index · OpenFEMA
Half the trips to work are shorter than 9 miles. Since 2013, Folsom has added 283 jobs, to 2,072 in 2023. Most working residents leave Folsom for work: only 3% work in town. The top destinations are Philadelphia (22%), Ridley Township (8%) and Lower Merion Township (3%).
| Folsom | Pennsylvania towns | U.S. towns | |
|---|---|---|---|
| Working residents who work in town | 2.7% | 6.3% | 8% |
| Below the poverty line | 6.3% | 7.6% | 9.6% |
Census LEHD 2023 · ACS
NOAA U.S. Climate Normals, 1991–2020
Folsom’s age of the median resident comes in at 37.6 years. Adults 35 to 64 are 46% of residents (38% statewide); adults 18 to 34 are 16% of residents (22% statewide). The share of residents in Folsom who are 65 or older: 15%. College graduates make up just over a third of adults 25 and older, against 35% across Pennsylvania.
| Folsom | Pennsylvania towns | U.S. towns | |
|---|---|---|---|
| Aged 65 or older | 15% | 21% | 18% |
| Median age | 37.6 years | 43.2 years | 40.5 years |
| Under 18 | 23% | 20% | 22% |
| Bachelor’s degree or more, 25+ | 34% | 29% | 29% |
52% women, 48% men
That’s an even split within the survey’s margin of ±3.4 points. Across Pennsylvania, 50.7% of residents are women.
| Folsom | PA | U.S. | |
|---|---|---|---|
| Under 10 | 15.1% | 10.8% | 11.6% |
| 10 to 17 | 8.2% | 9.7% | 10.3% |
| 18 to 24 | 5.7% | 9% | 9.1% |
| 25 to 34 | 10.3% | 13% | 13.7% |
| 35 to 44 | 23.8% | 12.6% | 13.2% |
| 45 to 54 | 8.4% | 11.9% | 12.2% |
| 55 to 64 | 13.6% | 13.6% | 12.7% |
| 65 to 74 | 9.1% | 11.4% | 10.2% |
| 75 and older | 5.8% | 8.1% | 7% |
| No diploma | 6.5% | 7.9% | 10.4% |
| High school | 32.9% | 32.9% | 26% |
| Some college | 16.4% | 15.1% | 19.1% |
| Associate’s | 10.7% | 8.9% | 8.8% |
| Bachelor’s | 25.2% | 20.9% | 21.6% |
| Graduate | 8.3% | 14.3% | 14.1% |
U.S. Census Bureau · ACS 2020-2024 5-year estimates
84% of Folsom households own their home. The rent at the middle of the market for Folsom comes to $1,540 a month. Bidding over the asking price: 52% of homes sold in the town.
| Folsom | Pennsylvania towns | U.S. towns | |
|---|---|---|---|
| Median rent | $1,540 a month | $1,115 a month | $1,185 a month |
| Households that own their home | 84% | 78% | 73% |
Census ACS, 2020–24 · Zillow Home Value Index · Redfin Data Center
5.9% of adults 18 to 64 have no health insurance in Folsom. Against the Pennsylvania average, Folsom comes out ahead on 6 CDC measures out of 26, and behind on 1. Two figures for adults in the town: 12% report frequent physical distress, 40% sleep under 7 hours.
| Folsom | Pennsylvania towns | U.S. towns | |
|---|---|---|---|
| Binge drink (CDC PLACES) | 20% | 18% | 16% |
| Frequent physical distress (CDC PLACES) | 12% | 14% | 14% |
| Sleep under 7 hours (CDC PLACES) | 40% | 38% | 36% |
| Obesity (CDC PLACES) | 31% | 35% | 35% |
| What stands out | Folsom | PA |
|---|---|---|
| Fewer older adults who have lost all their teeth | 10.6% | 14.5% |
| Fewer adults who have had a stroke | 3% | 3.7% |
| Fewer adults treating high blood pressure | 75.9% | 79.2% |
CDC PLACES 2025 · modeled estimates for adults · CMS · HRSA
| Biggest places to walk | Trails | Acres |
|---|---|---|
| 1. Folsom Field | — | 4 |
Trails & parks © OpenStreetMap contributors · Conserved land: USGS PAD-US
34 within 15 miles of the center of Folsom
About 3 of every 100 Folsom residents are enrolled in college, against 6 across Pennsylvania.
Unincorporated community in Pennsylvania, US
Folsom is a census-designated place (CDP) in Delaware County, Pennsylvania, United States. It is part of Ridley Township. The population was 8,323 at the 2010 census.
From Wikipedia, licensed CC BY-SA 4.0 · facts via Wikidata (CC0)
7 towns share a border with Folsom.
| Town | PA rank | Overall | Cost | Safety | Schools | Health |
|---|---|---|---|---|---|---|
| Folsom | — | — | — | — | — | — |
| Ridley Township | #480 | B+ | C | B | C+ | B+ |
| Prospect Park | #644 | B | C | B− | B− | B |
| Woodlyn | — | — | — | — | — | — |
| Swarthmore | #32 | A+ | D | A | A+ | A+ |
| Ridley Park | #232 | A | C | A | C+ | A− |
| Rutledge | — | — | — | — | — | — |
| Springfield Township | #228 | A | C− | C | A+ | A |
Folsom, Woodlyn and Rutledge aren’t graded (fewer than 1,000 residents, or not enough data). Compare Folsom with a neighbor →
Short answers, built from the data on this page.
We don’t grade Folsom yet; the figures below are still real.


