
Burlington 37 Cemetery, 2012
Burlington’s story
208 years in pictures
Census counts: 2,794 in 2000, 2,416 in 2020. The archive holds 5 old photos and papers going back to 2004 and 2 maps from 1903 on.
- 1818Burlington is settled
Each edition grades its towns against each other only.

Easy on the wallet, harder on other counts. Overall, Burlington earns a C+, which places it 737th of 987 in Ohio. That leaves it better than 38% of U.S. towns. Its weakest subject is health (D): CDC estimates put its residents' health behind 92% of the country. Cost of living is its strong suit: a typical home costs about $128K, 2.1 years of the Huntington metro’s $60K median household income. Its remaining grades are unremarkable: B− for schools and B− for hazard risk.
Figures: home values, Zillow · incomes, Census ACS, 2020–24 · health, CDC PLACES · schools, state test and graduation results · FEMA National Risk Index.
Where Burlington beats most towns, and one thing worth knowing.
Each subject compared with towns across the country (schools within Ohio), ordered by how far Burlington is from typical.
How TownRatings grades towns →
Census counts: 2,794 in 2000, 2,416 in 2020. The archive holds 5 old photos and papers going back to 2004 and 2 maps from 1903 on.
Burlington is unincorporated, so Lawrence County and regional agencies provide most services.
EPA SDWIS (Oct 9, 2026) · HIFLD + EIA-861 2025 · Census 2020 ZCTAs · NCES 2024–25 · registration: vote.gov, updated Aug 3, 2026.
Ordered by what stands out in Burlington.
Burlington has milder winter nights than almost anywhere else in Ohio, sends many workers across the state line to Ashland and is healthier than towns with similar incomes.
Against the 681 U.S. towns with household incomes like Burlington’s, it is healthier than 68%, so its D isn’t only a matter of income.
A quarter of adults say their health is fair or poor in Burlington, above both the Ohio town median (20%) and the median of U.S. towns (19%). Burlington: 17% of adults have diabetes. Only 10 of the 993 Ohio towns we compare have a lower share of adults who binge drink than Burlington. Of 32 CDC measures, Burlington beats the Ohio average on 2 and trails it on 14.
| Burlington | Ohio towns | U.S. towns | |
|---|---|---|---|
| High blood pressure (CDC PLACES) | 47% | 38% | 35% |
| Diabetes (CDC PLACES) | 17% | 13% | 12% |
| Binge drink (CDC PLACES) | 13% | 17% | 16% |
| Get no exercise (CDC PLACES) | 35% | 28% | 25% |
| What stands out | Burlington | OH |
|---|---|---|
| Fewer binge drinkers | 13% | 16.6% |
| More adults treating high blood pressure | 83% | 79.2% |
| More older adults who have lost all their teeth | 22.3% | 15.3% |
CDC PLACES 2025 · modeled estimates for adults · CMS · HRSA
January nights average 25°, the #2 highest of 2,573 Ohio places with climate records; July afternoons average 87.1°.
About 10 inches of snow falls in a winter. No town among the 993 in Ohio we compare has a higher January low than Burlington. The typical July afternoon high for Burlington comes to 87°F.
| Burlington | Ohio towns | U.S. towns | |
|---|---|---|---|
| July high | 87°F | 84°F | 85°F |
| January low | 25°F | 20°F | 22°F |
NOAA U.S. Climate Normals, 1991–2020
57% of working residents cross a state line to work, Ashland among the top destinations.
Half of commuters travel less than 9 miles. Employers in Burlington shed 150 jobs between 2013 and 2023, to 962. Commuting out is the norm in the town: 6% of working residents work locally. Its typical journey to work stands at 22 minutes, against 24 minutes in Ohio’s towns and 25 minutes across U.S. towns.
| Burlington | Ohio towns | U.S. towns | |
|---|---|---|---|
| Below the poverty line | 14% | 9.1% | 9.6% |
| Average trip to work | 22 minutes | 24 minutes | 25 minutes |
| Working residents who work in town | 5.6% | 6.9% | 8% |
Census LEHD 2023 · ACS
Burlington’s natural-hazard score from FEMA is 47 of 100. The national flood insurance program has paid one claim here since 2021. Of the losses FEMA expects locally, 72% come from inland flooding and 13% from heat waves.
FEMA National Risk Index · OpenFEMA
Museums, parks, gardens and other places to visit around Burlington. Close and well known come first.
 in town Theme parkCamden Park
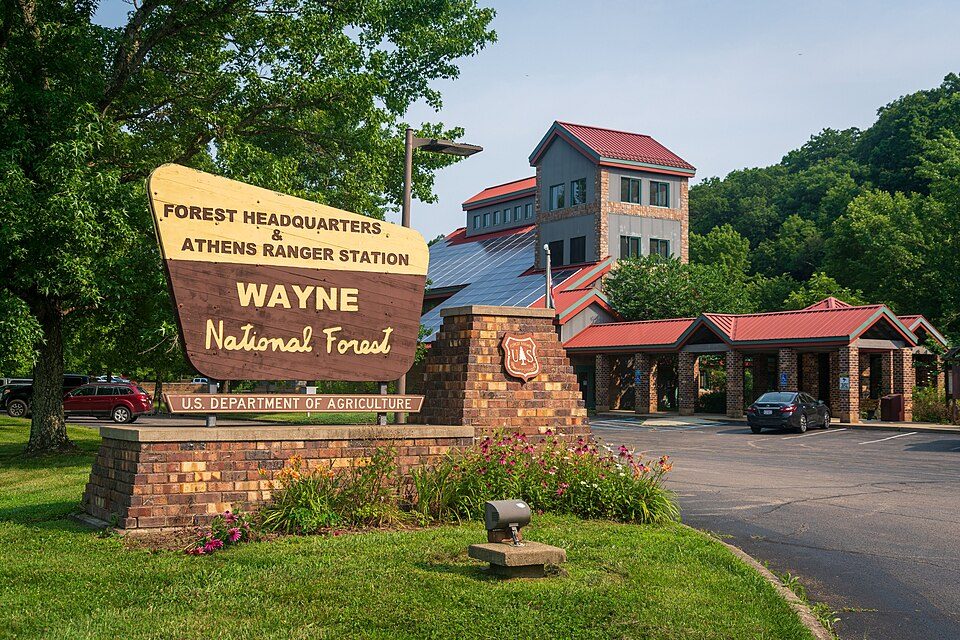 20 mi National forestWayne National Forest
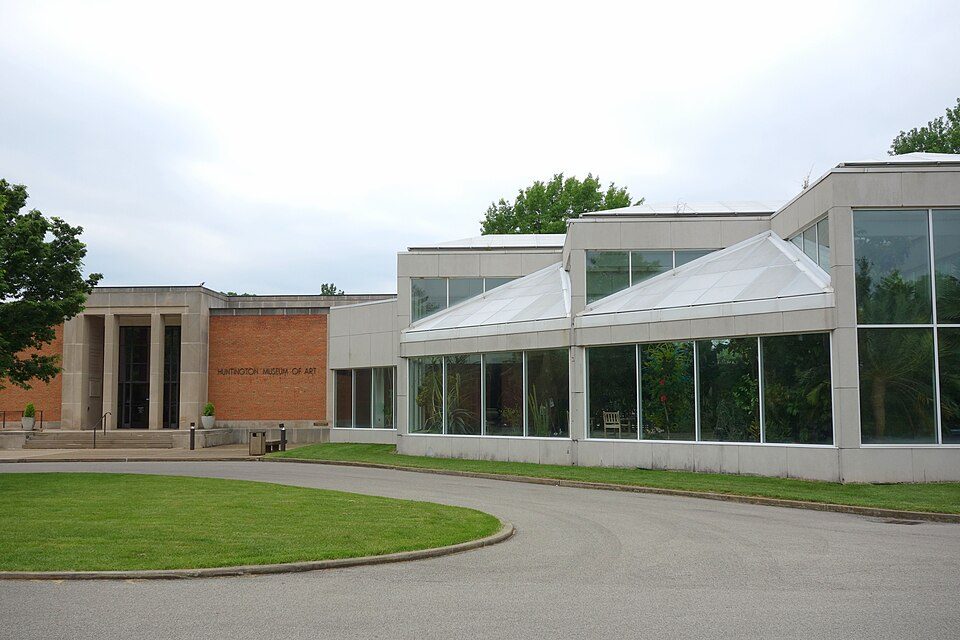 5 mi MuseumHuntington Museum of Art
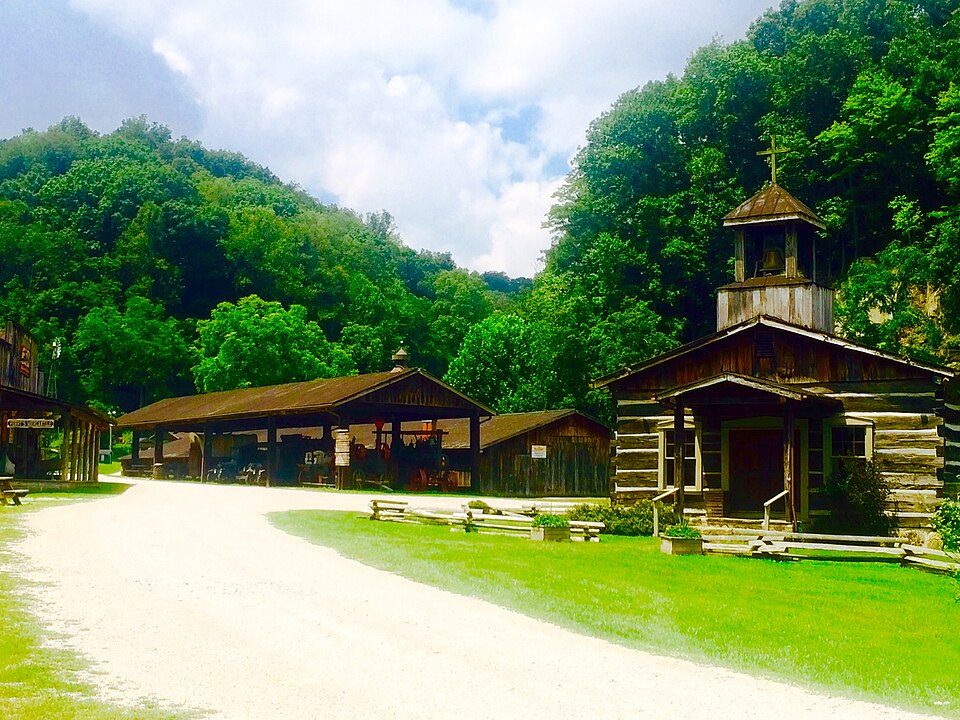 4 mi MuseumHeritage Farm Museum and Village3 mi MuseumMuseum of Radio and Technology
Camden Park: Carol M. Highsmith, Public domain · Wayne National Forest: Forest Service, USDA, Public domain · Huntington Museum of Art: Daderot, CC0 · Heritage Farm Museum and Village: Zeo1989, CC BY-SA 4.0
6 within 15 miles of the center of Burlington
About 2 of every 100 Burlington residents are enrolled in college, against 6 across Ohio.
Census-designated place in Ohio, United States
Burlington is an unincorporated community and census-designated place in Lawrence County, Ohio, United States, along the Ohio River. The population was 2,416 at the 2020 census. Connected to neighboring Huntington, West Virginia and connected via the West Huntington Bridge over the Ohio River, it is part of the Huntington–Ashland metropolitan area. Burlington was once the leading community of Lawrence County, being the first county seat and the location of the county's first post office. “The Memory Man” by David Baldacci takes place in Burlington. The main character is Amos Decker. There are 7 books in this series.
From Wikipedia, licensed CC BY-SA 4.0 · facts via Wikidata (CC0)
5 towns share a border with Burlington.
| Town | OH rank | Overall | Cost | Safety | Schools | Health |
|---|---|---|---|---|---|---|
| Burlington | #737 | C+ | A− | — | B− | D |
| Fayette Township | #732 | C+ | A− | — | B | D |
| South Point | #712 | C+ | B | — | B− | C− |
| Union Township | #784 | C | B+ | — | B | C |
Burlington, Fayette Township, South Point and Union Township report no FBI crime data of their own. Compare Burlington with a neighbor →
Short answers, built from the data on this page.
Burlington grades C+ overall, better than 38% of U.S. towns and #737 of 987 in Ohio. It grades D for health and B− for schools. Health is its weak spot, with a D.
Not for the area. Cost of living, which also weighs rents, property taxes and how many households pay 30% or more of their income for housing, grades A−.


