306 years in pictures
Census counts: 1,578 in 1820, 11,541 in 2020. The archive holds 6 old photos and papers going back to 1868 and 6 maps from 1893 on.
- 1720Patterson is settled
Each edition grades its towns against each other only.

Homes are expensive, about $410K for a typical one and 4.1 times the New York metro’s $99K median household income. Overall it grades C+, ranked 505th of 745 in New York. Natural-hazard risk is low and it has 31 miles of trail. Patterson’s average trip to work is 37 minutes, above both New York’s towns (25 minutes) and U.S. towns (25 minutes). On history, just 61 of New York’s 1,216 towns do worse. The biggest place to walk is Cranberry Mountain Wildlife Management Area, 1,095 acres with 7.9 miles of trail.
Where Patterson beats most towns.
Census counts: 1,578 in 1820, 11,541 in 2020. The archive holds 6 old photos and papers going back to 1868 and 6 maps from 1893 on.
Each subject compared with towns across the country (schools within New York), ordered by how far Patterson is from typical.
Its grades run from A for hazard risk (better than 93% of comparable towns) to D− for cost of living (better than 4%), so the C+ overall blends very different results.
How TownRatings grades towns →
Museums, parks, gardens and other places to visit around Patterson. Close and well known come first.
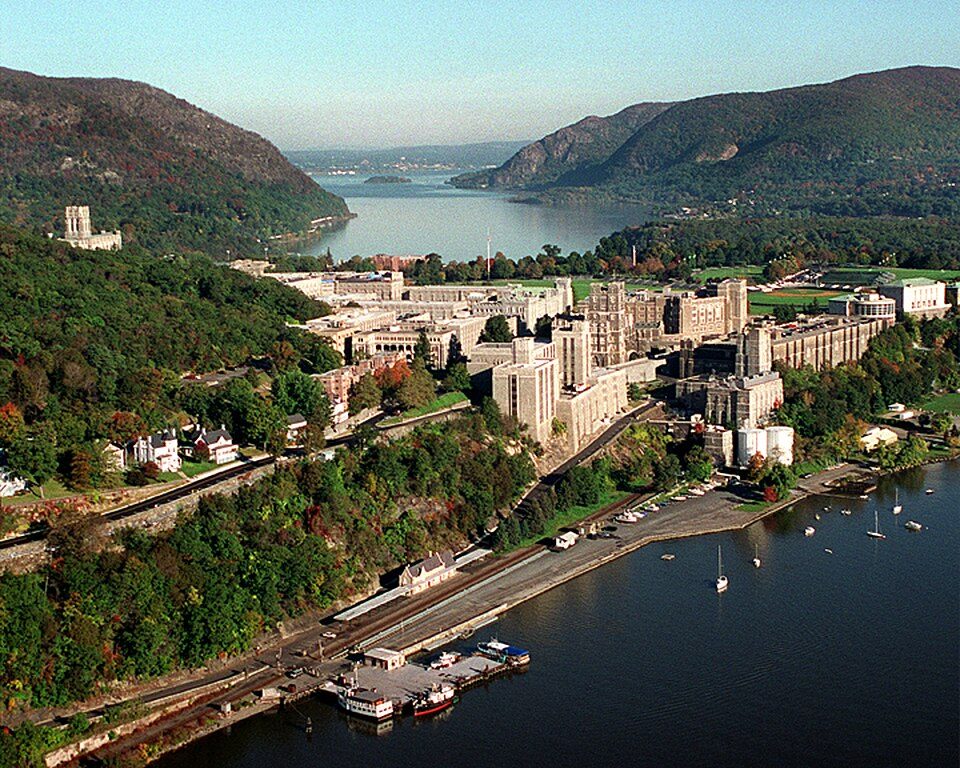
Big draw20 mi MuseumUnited States Military Academy
7 mi LakeCandlewood Lake
34 mi LandmarkFerncliff Cemetery
in town State parkWonder Lake State Park
25 mi National Historic SiteHome of Franklin D. Roosevelt National Historic Site102K visitors a year
35 mi Stadium & arenaYale BowlUnited States Military Academy: USMA Public Affairs Office, Public domain · Candlewood Lake: Carol M. Highsmith, Public domain · Ferncliff Cemetery: Anthony22 at English Wikipedia, CC BY-SA 3.0 · Wonder Lake State Park: Anthony22 (talk), CC BY-SA 3.0 · Home of Franklin D. Roosevelt National Historic Site: Crunch, CC BY-SA 4.0 · Yale Bowl: Kenneth Zirkel, CC BY-SA 4.0
Who provides power, water and the rest in Patterson, and how to reach them.
EPA SDWIS (Oct 9, 2026) · HIFLD + EIA-861 2025 · Census 2020 ZCTAs · NCES 2024–25 · registration: vote.gov, updated Aug 3, 2026.
Ordered by what stands out in Patterson.
Patterson scores below Southeast and its other neighbors on health, but it has lost a quarter or more of its jobs in ten years and has many renters stretched by housing costs.
Patterson’s trail density is 1.0 miles per square mile.
| Biggest places to walk | Trails | Acres |
|---|---|---|
| 1. Michael Ciaiola Conservation Area | 9.7 mi | 626 |
| 2. Cranberry Mountain Wildlife Management Area | 7.9 mi | 1,095 |
| 3. Wonder Lake State Park | 6.9 mi | 750 |
Trails & parks © OpenStreetMap contributors · Conserved land: USGS PAD-US
Its public schools are run by the Carmel Central School District. Two of its 3 schools are below, each with why it’s listed.
| School | Level | Students | Letter |
|---|---|---|---|
| George Fischer Middle SchoolLargest public middle schoolGrades 5–8 | Grades 5–8 | 1,138 | C− |
| Green Chimneys School PrivateLargest high schoolGrades 2–12 | Grades 2–12 | 209 | – |
NCES · EDFacts · graded within NY on state tests and graduation
Expected storm and flood damage is lower than in 90% of U.S. communities. Since 1979, 6 flood insurance claims have been paid out in Patterson.
FEMA flood insurance claims · FEMA National Risk Index · OpenFEMA
Jobs based here fell from 3,392 in 2013 to 2,531.
Most working residents leave Patterson for work: only 7% work in town. 18% of Patterson residents live below the poverty line. Jobs based in Patterson fell to 2,531 in 2023, 861 fewer than in 2013.
| Patterson | New York towns | U.S. towns | |
|---|---|---|---|
| Below the poverty line | 18% | 9.5% | 9.6% |
| Median household income | $102,000 | $82,000 | $80,000 |
| Work from home | 13% | 12% | 11% |
| Working residents who work in town | 6.7% | 10% | 8% |
Census LEHD 2023 · ACS
All 3 graded neighbors score healthier than its B+, from Southeast (A) to Pawling (A). Against the 8,260 U.S. towns with household incomes like Patterson’s, it is healthier than 54%, a smaller edge than it has nationally: part of it comes with its incomes.
Patterson tracks New York closely on all 32 CDC measures. 19% of adults have been diagnosed with depression in Patterson.
| Patterson | New York towns | U.S. towns | |
|---|---|---|---|
| Depression (CDC PLACES) | 19% | 21% | 23% |
| High blood pressure (CDC PLACES) | 31% | 34% | 35% |
| Sleep under 7 hours (CDC PLACES) | 39% | 37% | 36% |
| Obesity (CDC PLACES) | 31% | 33% | 35% |
CDC PLACES 2025 · modeled estimates for adults · CMS · HRSA
Patterson has chilly, snowy winters and pleasant summers. July afternoons reach 84°, January nights drop to 18° and about 58 inches of snow falls in a winter.
NOAA U.S. Climate Normals, 1991–2020
Adults 35 to 64 are 46% of residents (39% statewide). 38% of adults 25 and older have a bachelor’s degree or more, vs 40% across New York.
| Patterson | New York towns | U.S. towns | |
|---|---|---|---|
| Under 18 | 17% | 20% | 22% |
| Aged 65 or older | 16% | 20% | 18% |
| Bachelor’s degree or more, 25+ | 38% | 32% | 29% |
| Median age | 41 years | 43 years | 40.5 years |
50% women, 50% men
That’s an even split within the survey’s margin of ±2.4 points. Across New York, 51.2% of residents are women. Median age: women 42.9, men 38.4.
| Patterson | NY | U.S. | |
|---|---|---|---|
| Under 10 | 8.9% | 11% | 11.6% |
| 10 to 17 | 8.3% | 9.5% | 10.3% |
| 18 to 24 | 8.3% | 8.9% | 9.1% |
| 25 to 34 | 12.1% | 14.2% | 13.7% |
| 35 to 44 | 18.5% | 13% | 13.2% |
| 45 to 54 | 10.8% | 12.2% | 12.2% |
| 55 to 64 | 16.8% | 13.3% | 12.7% |
| 65 to 74 | 8.6% | 10.3% | 10.2% |
| 75 and older | 7.6% | 7.6% | 7% |
| No diploma | 6.7% | 12% | 10.4% |
| High school | 33.3% | 24.3% | 26% |
| Some college | 14.3% | 14.6% | 19.1% |
| Associate’s | 8% | 8.8% | 8.8% |
| Bachelor’s | 22.7% | 22.4% | 21.6% |
| Graduate | 14.9% | 17.9% | 14.1% |
U.S. Census Bureau · ACS 2020-2024 5-year estimates
66.8% of renter households pay 30% or more of their income for housing, against 52.1% across New York.
The median rent in Patterson is $2,048 a month.
| Patterson | New York towns | U.S. towns | |
|---|---|---|---|
| Median rent | $2,048 a month | $1,098 a month | $1,185 a month |
| Households that own their home | 81% | 75% | 73% |
Census ACS, 2020–24 · Zillow Home Value Index · Redfin Data Center
1 within 15 miles of the center of Patterson
About 7 of every 100 Patterson residents are enrolled in college, about the same as New York.
Where Patterson’s working residents go each day. Line width shows the share.
Census LEHD 2023
Town in New York, United States
Patterson is a town in Putnam County, New York, United States. The town is in the northeastern part of the county and Interstate 84 passes through its southwestern section. The population was 11,541 at the 2020 census. The town is named after farmer Matthew Paterson. The original name was spelled “Paterson,” but was changed to its current spelling in the mid-19th century, reportedly because mail delivery confusion with Paterson, New Jersey.
From Wikipedia, licensed CC BY-SA 4.0 · facts via Wikidata (CC0)
7 towns share a border with Patterson.
All 3 graded towns on its borders grade higher than its C+; Southeast (B) is closest.
| Town | NY rank | Overall | Cost | Safety | Schools | Health |
|---|---|---|---|---|---|---|
| Patterson | #505 | C+ | D− | — | B− | B+ |
| Pawling | #193 | A− | C− | — | B | A |
| Kent | #141 | A− | D | A | B− | A |
| Putnam Lake | — | — | — | — | — | — |
| Southeast | #332 | B | D | — | C+ | A |
| Lake Carmel | — | — | — | — | — | — |
Patterson, Pawling and Southeast report no FBI crime data of their own. Putnam Lake and Lake Carmel aren’t graded (fewer than 1,000 residents, or not enough data). Compare Patterson with a neighbor →
Short answers, built from the data on this page.
Patterson grades C+ overall, better than 35% of U.S. towns and #505 of 745 in New York. It grades B+ for health and B− for schools. Cost of living is its weak spot, with a D−.
Yes. The typical home is worth about $410,000, 22% below the New York typical home. Cost of living, which also weighs rents, property taxes and how many households pay 30% or more of their income for housing, grades D−.