








Sugar Creek Charter
4101 N Tryon Street, Charlotte, NC 28206 · (704) 509-5470
Charlotte’s School Grade B− better than 46% of North Carolina school districts
What stands out about Sugar Creek Charter
- Its own letter, C+: better results than 36% of North Carolina’s public schools
- Math proficiency 9 pts below the state
- Reading / language arts 8 pts below the state
- Larger classes: 23 students per teacher
Test scores
2020–21Its own letter, C+, places these results among North Carolina’s 2,529 public schools with results. Source: EDFacts via Urban Institute Education Data Portal (SY2020-21).
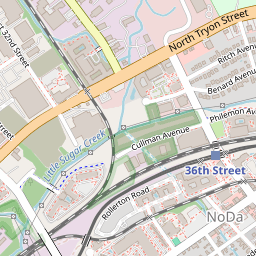
Location
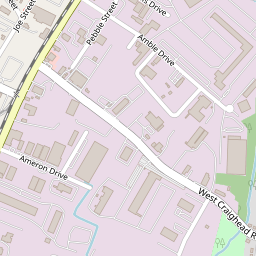
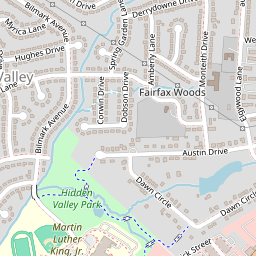
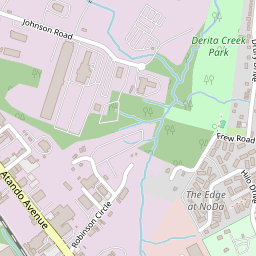
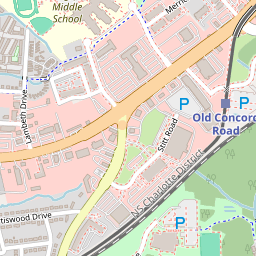
Directions ↗4101 N Tryon Street, Charlotte
Students
Down 5.9% since 2020–21.
As reported to NCES, share of students with a reported race or ethnicity.
Parents talk
Questions and answers about Sugar Creek Charter from Charlotte families.
School facts: U.S. Department of Education (NCES), 2024–2025 school year. Test scores: EDFacts via Urban Institute Education Data Portal (SY2020-21). A school’s letter is our own summary of its reading and math results against North Carolina’s other public schools; Charlotte’s School Grade is built from its districts’ results. Map: © OpenStreetMap contributors.